Department Performance Report
- Productivity
- Chat Volume.
With the department performance report, you can figure out
- How well your team is handling incoming conversation volume,
- the responsiveness to customer queries
- what customers think of your support.
Department Performance Report
In the department performance report, you can track,
- Productivity
- Chat Volume
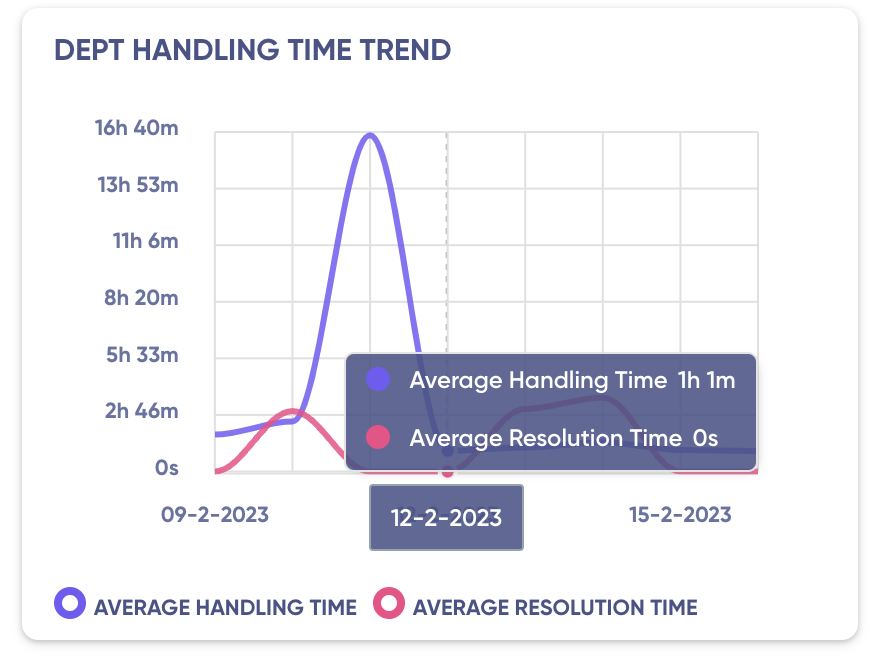
Productivity
Through the Dept Handling time trend widget, you can see quickly if your platform is able to resolve customers’ issues. You will be able to see how much time on average is spent in handling and resolving your customers’ queries. You can see more details by hovering your mouse pointer along the graph. You can also see the response rates and chat volume for each day in a table format right below the graphs.
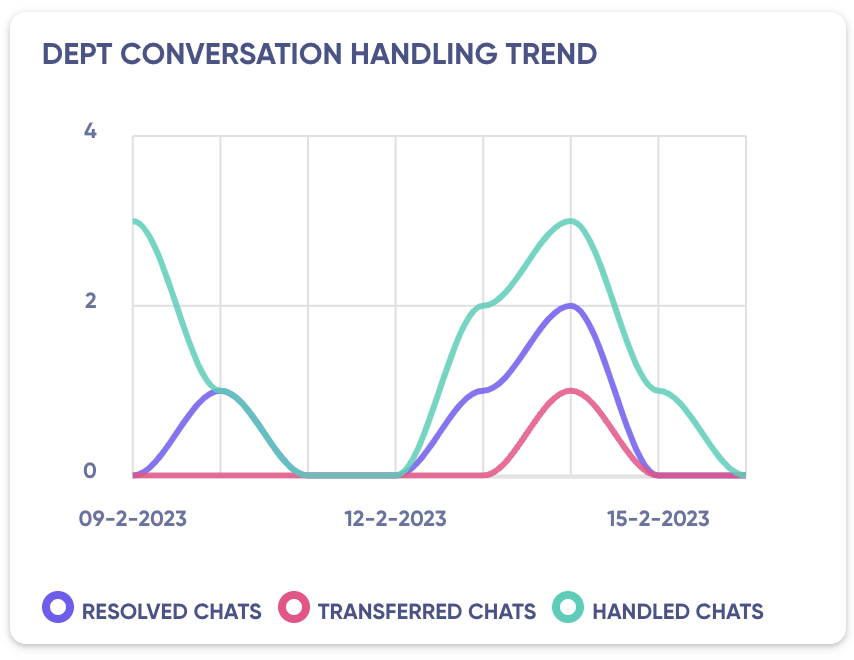
Chat Volume
Through the Dept Conversations Handling trend widget, you can see how well your team is managing chat volume. You will be able to see the volume of conversations handled and how many conversations were resolved. You can see more details by hovering your mouse pointer along the graph. You can also see the response rates and chat volume for each day in a table format right below the graphs.
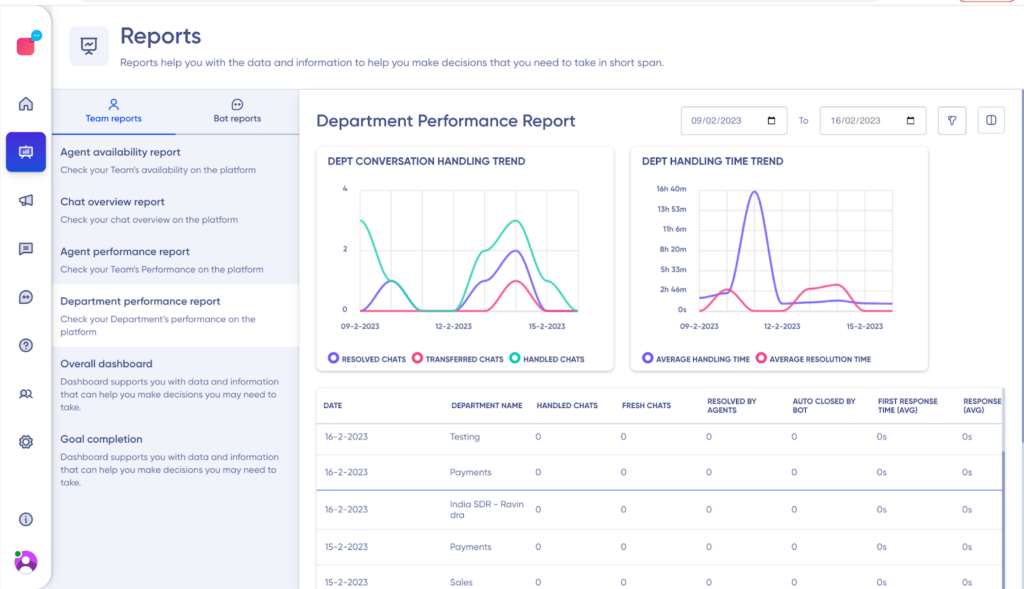
Performance table
Through the performance table, you can see how well your team is handling incoming conversation volume, the responsiveness to customer queries and what customers think of your support.
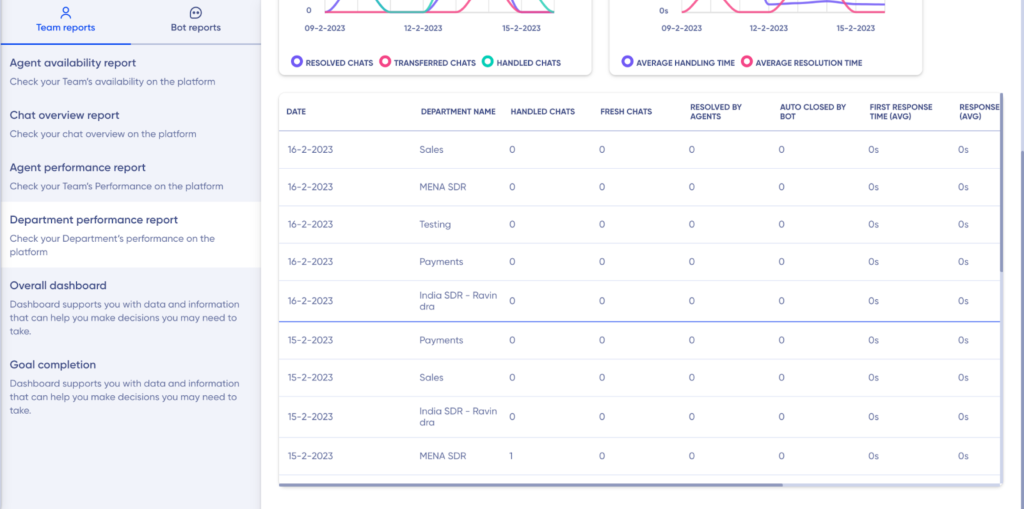
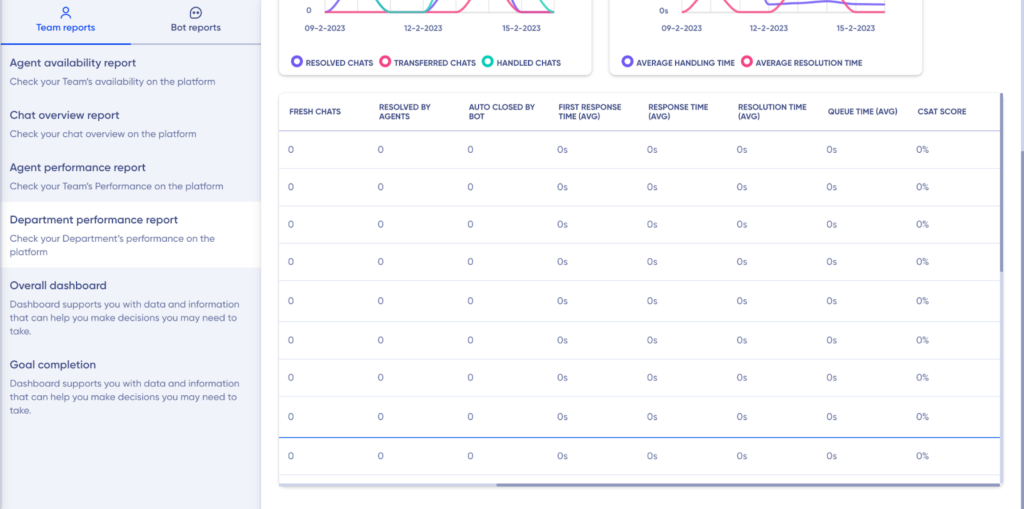
Columns inside the table
- Date
- Department name
- Handled chats
- Fresh chats
- Transferred chats
- Resolved by agents
- Auto closed by the bot
- First response time (AVG)
- Response time (AVG)
- Resolution time (AVG)
- Queue time (AVG)
- CSAT score
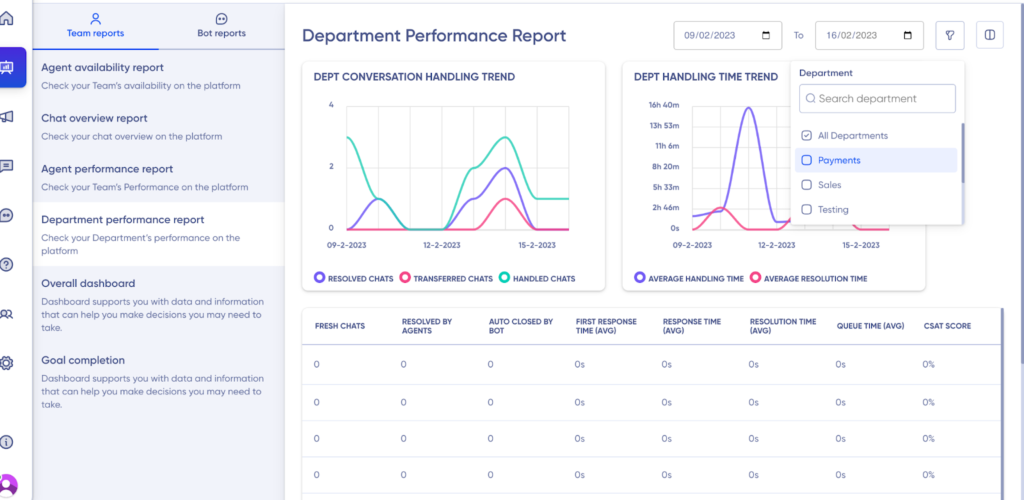
Filters
You can track this data for a specific time period by using the ‘Filter’ option in the top right corner.
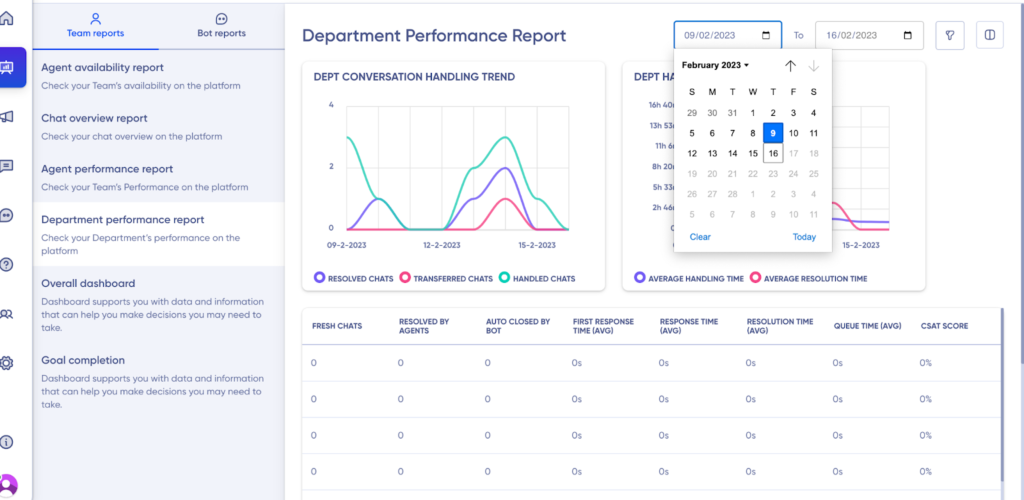
Note:
- When a specific time filter is chosen, all the chats which had any activity during the chosen time grouped on a daily basis will be displayed.
- The metrics are calculated based on the data available against a conversation on a daily basis i.e context from a previous day will not be carried forward.
You can add, remove or rearrange the column order in the table using the Column option on the top right corner
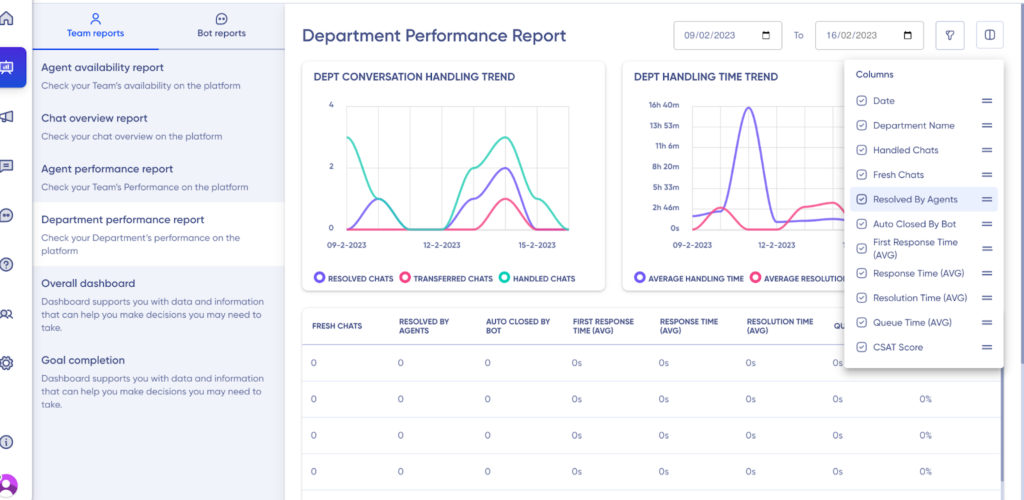
You can also apply filters for:
- Department
- Channels
- Sales
- Testing