- Bot Performance Report
- Productivity
- Chat Volume.
With the bot performance report, you can figure out
- How well the bot is handling incoming conversation volume,
- the responsiveness to customer queries
- what customers think of your support.
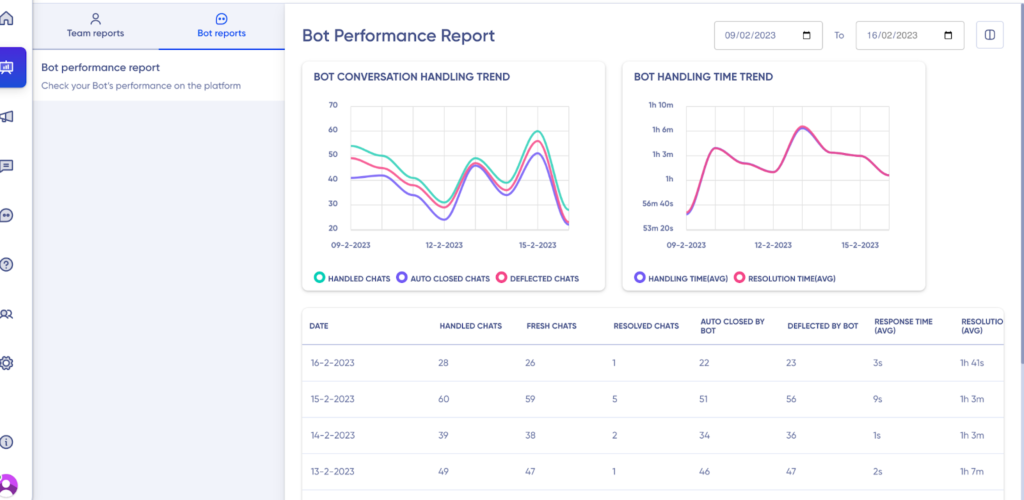
Bot Performance Report
In this bot performance report, you can track,
- Productivity
- Chat Volume
Productivity Analytics
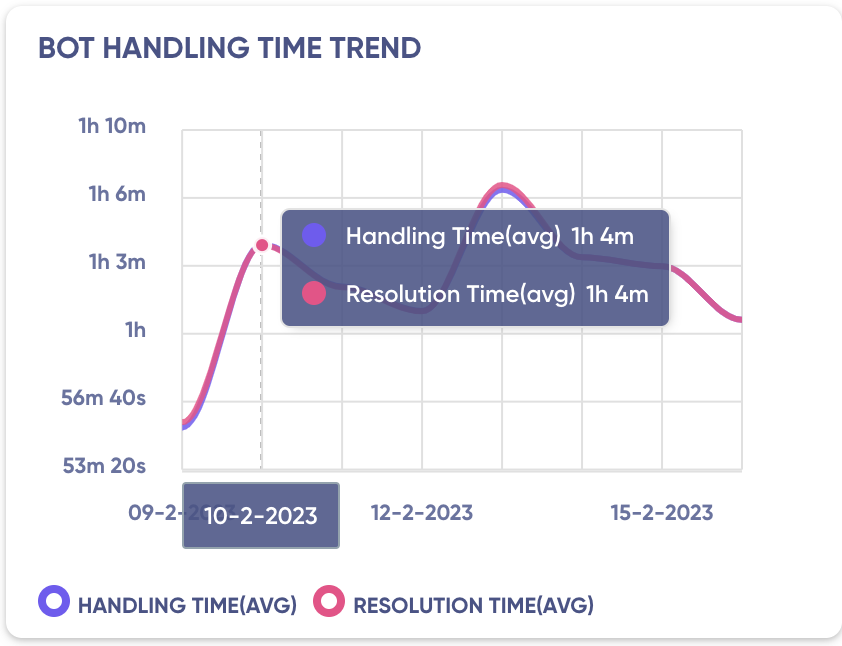
Through the Bot handling time trend widget, you can see quickly if the bot is able to resolve customers’ issues. You will be able to see how much time on average is spent in handling and resolving your customer’s queries. You can see more details by hovering your mouse pointer along the graph. You can also see the response rates and chat volume for each day in a table format right below the graphs.
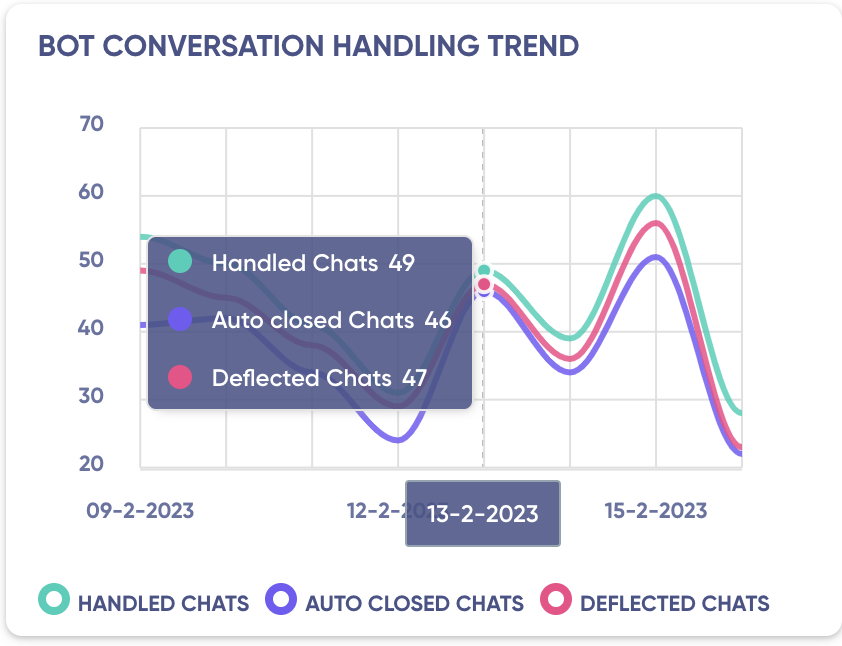
Chat Volume
Through the Bot Conversation Handling time trend widget, you can see quickly how the bot is handling the chat volume. You will be able to see the volume of conversations handled and how many conversations were resolved. You can see more details by hovering your mouse pointer along the graph. You can also see the response rates and chat volume for each day in a table format right below the graphs.
Performance table
Through the performance table, you can see how well your bot is handling incoming conversation volume, the responsiveness to customer queries and what customers think of your support.
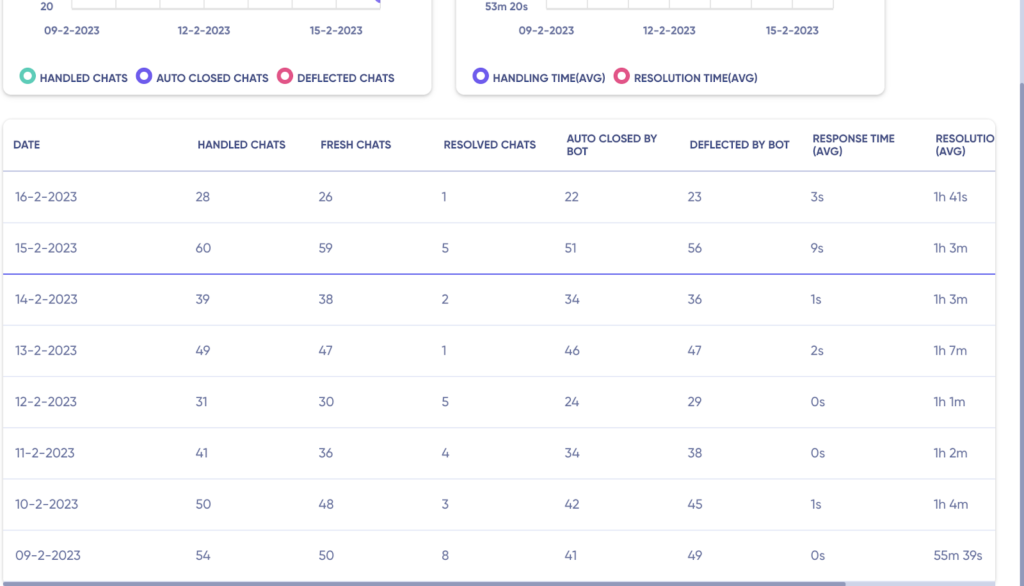
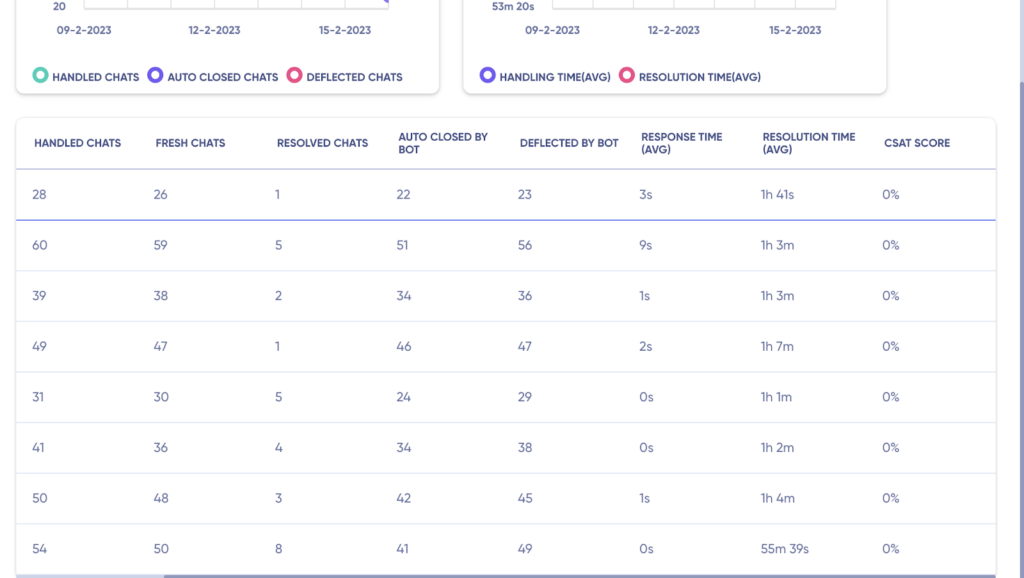
Columns inside the table
- Date
- Handled chats
- Fresh chats
- Resolved chats
- Auto closed by the bot
- Deflected by bot
- First Response time (AVG)
- Response time (AVG)
- Resolution time (AVG)
- CSAT Score
Note: Data is aggregated per day
Filter
You can track this data for a specific time period by using the ‘Filter’ option in the top right corner.
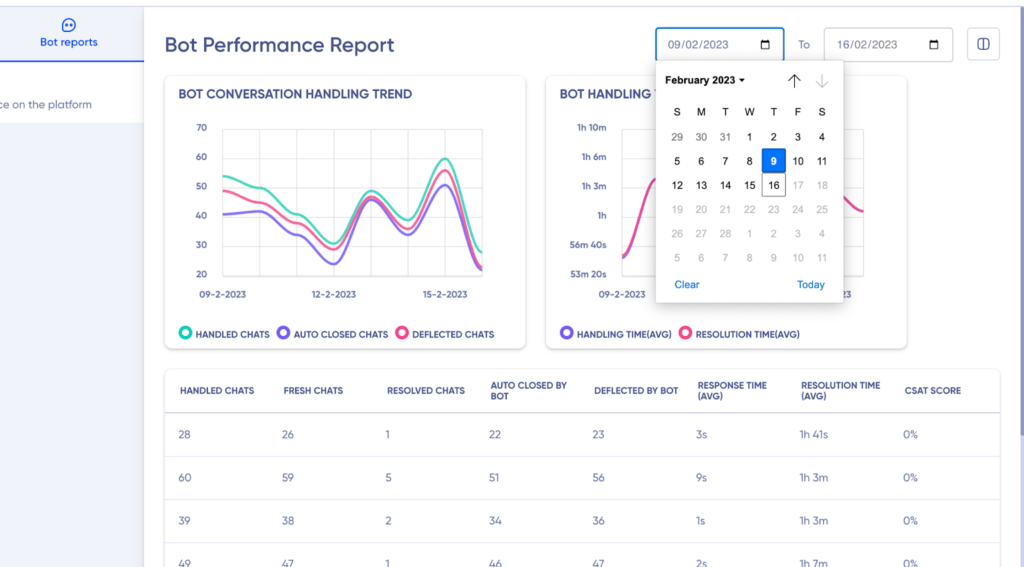
Note
- When a specific time filter is chosen, all the chats which had any activity during the chosen time grouped on a daily basis will be displayed.
- The metrics are calculated based on the data available against a conversation on a daily basis i.e context from a previous day will not be carried forward.
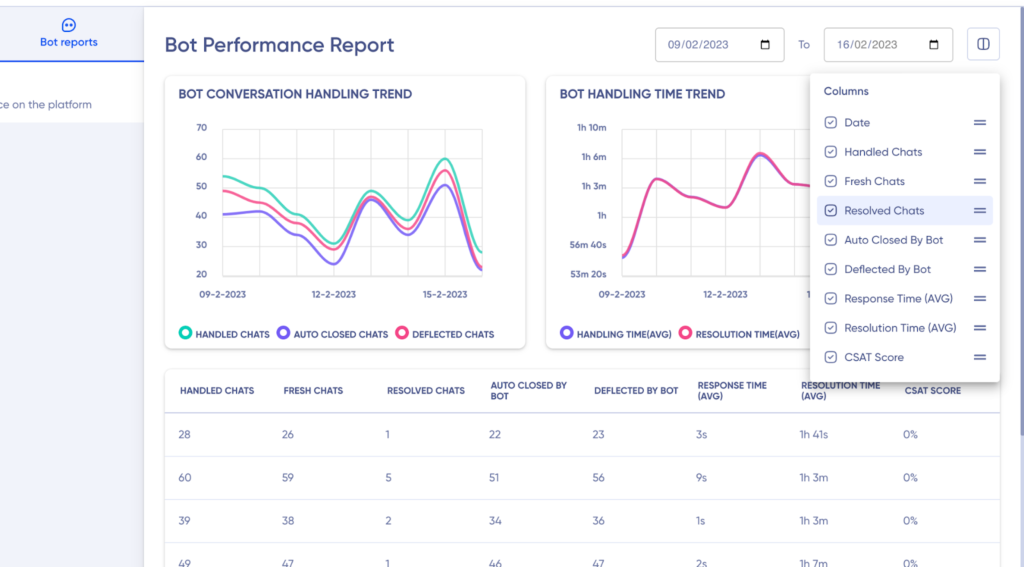
You can add, remove or rearrange the column order in the table using the Column option on the top right corner
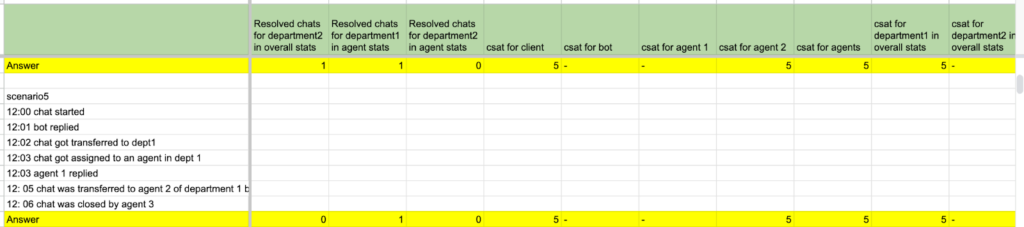
For calculating Chat Counts
Various conversation scenarios are tracked at the backend, and when specific events within these scenarios are triggered, they are assigned a value of 1 in the corresponding KPI columns. For instance, in the conversation scenario depicted below, each event that occurs during the conversation is recorded in the rows, and the associated KPIs are indicated in the columns. When an event such as chat start or bot reply occurs, the corresponding column is marked, and these values are aggregated in the final calculation.
Handled Chats
Handled Chats refer to the total number of chats that had any activity, such as messages sent or received, interactions with the bot, or agent involvement, during a chosen duration.
For example, let’s consider a 24-hour duration from 8:00 AM to 8:00 AM the next day. If there were 50 chats initiated within this timeframe, but only 40 of them had any activity, including messages exchanged between the customer and the bot or agent, the count of Handled Chats would be 40. The remaining 10 chats that had no activity during this duration would not be included in the Handled Chats metric. This metric provides insights into the overall engagement and interaction level of chats during a specific timeframe.
Fresh Chats
Fresh Chats refer to the total number of chats that started and had activity within a chosen duration. These chats represent new and active conversations initiated by customers or users during a specific timeframe.
Resolved Chats
Resolved Chats refer to the total number of chats that were successfully resolved by bots during a chosen duration. These chats indicate customer interactions that were handled and resolved entirely through automated conversations without the need for human intervention.
For example, let’s consider a 24-hour duration from 12:00 AM to 11:59 PM. If there were 50 chats initiated during this timeframe and 30 of them were successfully resolved by the bot without any agent involvement, the count of Resolved Chats would be 30.
Auto Closed By Bot
Auto Closed Chats refer to the total number of chats that were automatically closed by the bot without any agent involvement during a chosen duration. These chats indicate customer interactions that reached a predefined resolution point or condition, triggering the bot to close the chat without the need for human intervention.
For example, let’s consider a 24-hour duration from 12:00 AM to 11:59 PM. During this timeframe, there were 100 chats initiated by customers. Out of these, 70 chats were resolved through automated responses and met the predefined resolution criteria, leading to the bot automatically closing the chat.
Deflected By Bot
Deflected By Bot refers to the chats that were closed by the Bot. This includes cases where a block has been directly linked to the closed conversation and chats closed due to inactivity.
CSAT Score
CSAT is a metric that measures the level of customer satisfaction with the provided service or experience. It represents the percentage of registered CSAT scores based on customer feedback. The distribution of chat counts that received thumbs down (ratings 1 and 2) and thumbs up (ratings 4 and 5) is also provided as a percentage of the total CSAT scores registered within the selected period.
Calculation of CSAT for 5-star ratings:
CSAT = (Number of satisfied customers (ratings 4 and 5) / Number of survey responses) x 100
Calculation of CSAT for thumbs up/down ratings:
CSAT = (Number of thumbs up / Number of survey responses) x 100
For Calculating Different Chat Duration
Different conversation scenarios are monitored in the backend, and when a particular event takes place, a true value is assigned to the corresponding metric/KPI listed in the columns. The time duration between two consecutive true events represents the final value for that specific KPI.
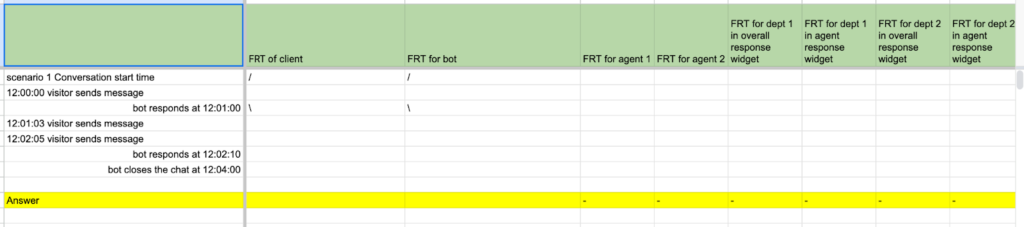
For instance, consider the scenario shown below. In Scenario 1, a conversation begins at 12:00:00, resulting in true values assigned to the associated KPIs in the columns. Subsequently, when the bot responds at 12:01:00, a true value is assigned to the relevant KPI, such as FRT (First Response Time). The time elapsed between these two events determines the final value of the KPI. In this example, the FRT is 00:01:00.
Response Time (Avg)
The average response time represents the average duration, expressed in hh:mm:ss format, of the total response time across all the chats assigned to a bot
For example, if an agent handled three chats with respective total response times of 900, 880, and 2000 milliseconds, the average response time would be calculated by summing up all the response times and dividing the total by the count of response times.
Resolution Time (Avg)
The average resolution time is a metric that measures the average duration, expressed in hh:mm:ss format, of the time it takes to resolve a chat. It represents the average time taken by a bot to resolve a chat from the moment it was assigned to them successfully.
Calculation: The average resolution time is calculated by summing up the resolution times of all the chats assigned to an agent and dividing the total by the count of resolved chats.