We have improved CSAT (Customer Satisfaction) reporting by introducing a detailed report known as the Bot CSAT Report. This new report provides comprehensive insights into the satisfaction levels of your customers. By analysing customer feedback, and ratings, the Bot CSAT Report allows you to identify areas of improvement. This enhanced reporting system enables us to better understand customer needs and ultimately enhance the overall customer experience.
With the Bot CSAT report, you can figure out:
- what customers think of your support.
- And what segment of the flow needs improvement.
Overview
In this Bot CSAT report, you can track,
- Individual and overall Customer Satisfaction scores.
- CSAT trends.

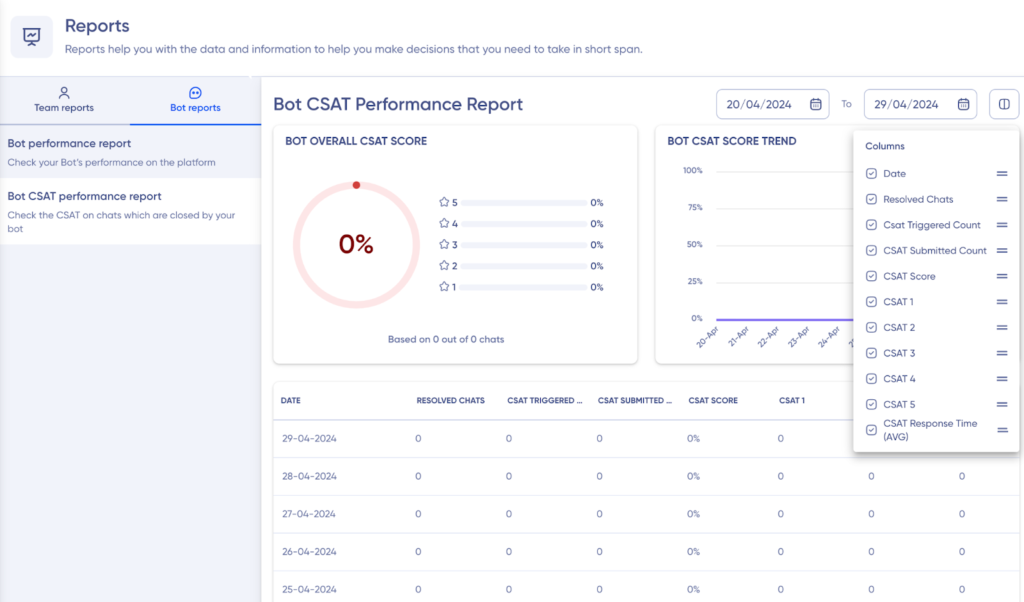
BOT CSAT Analytics
The initial graph provides an overview of the CSAT scores, including the distribution of ratings (1 to 5) given by customers. The overall score is represented in percentage, as can be seen in the below graph.

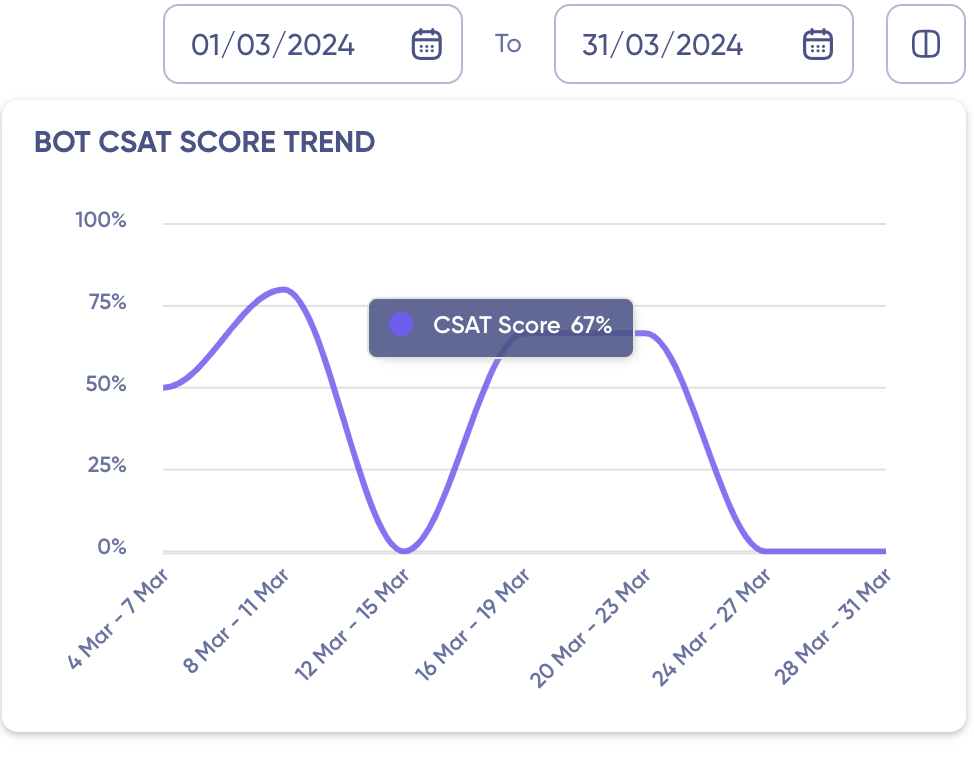
The next graph represents the CSAT score trends as given on any day. This graph is a visual representation of the CSAT scores over a period of time, showcasing the fluctuations and patterns in customer satisfaction. By analysing this graph, you can gain insights into how customer satisfaction has been evolving and identify any potential areas of improvement.
Performance Table
Through the performance table, you can see date wise CSAT trends, the number of CSAT triggered, and what customers think of your support.
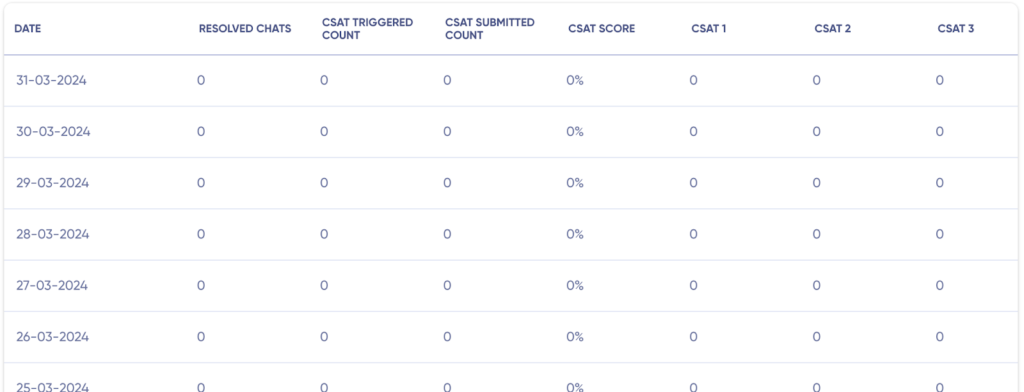
Columns Inside the Table
- Resolved Chats: The number of chats resolved on a particular day by the bot will be added against the date in this column.
- Chat Triggered Count: The Chat Triggered Count column will show how many times the CSAT flow was triggered for the number of chats resolved by the bot on a particular day.
- CSAT Submitted Count: Following the CSAT trigger, customers are prompted to submit their score. The number of customer submissions will be displayed in this column.
- CSAT Score: This column will showcase the average CSAT score of the bot on a particular day/timeframe.
- CSAT 1: This column displays the number of instances where customers rated the bot with a CSAT score of 1.
- CSAT 2: This column displays the number of instances where customers rated the bot with a CSAT score of 2.
- CSAT 3: This column displays the number of instances where customers rated the bot with a CSAT score of 3.
- CSAT 4: This column displays the number of instances where customers rated the bot with a CSAT score of 4.
- CSAT 5: This column displays the number of instances where customers rated the bot with a CSAT score of .5
- CSAT Response Time (Avg): This column showcases the average response time taken by customers to submit CSAT scores.
Note: You can add, remove or rearrange the column order in the table using the Column option in the top right corner.
Filter
- When a specific time filter is chosen, all the chats which had any activity during the chosen time grouped on a daily basis will be displayed.
- The metrics are calculated based on the data available against a conversation on a daily basis i.e. context from a previous day will not be carried forward.