It’s our mission to ensure the Verloop.io platform continues to exceed your expectations and help you find the right information aligned with your goals. The dashboard enables you to see real-time data of KPIs and customer support metrics through widgets.
Admins and Managers can see 13 widgets and filter these per Department to further narrow down the data to get more specific information. By default, all widgets will be enabled for you. If you don’t wish to see any, you can go ahead and hide them. The view of these widgets is completely customisable according to your need.
Note: The information shown on this dashboard is for chats happening between 12:00 AM midnight to 11:59 PM of one day.
Looking for specific information? Click the link below to jump directly to that section
- Agent CSAT
- BOT CSAT
- Overall CSAT
- Overall Chat Statistics
- Agent Chat Statistics
- Bot Chat Statistics
- Agent Status
- Team Capacity
- Hourly Chat Traffic
- Chat Status
- Overall Response Statistics
- Bot Response Statistics
- Agent Response Statistics
Let’s look at all these widgets and what information they show.
1. Agent CSAT
This widget will show you the Agents’ customer satisfaction (CSAT) score. The widget will show 3 important things
- Aggregate CSAT score received by all the agents till now starting at 00:00 hrs today.
- Percentage distribution of CSAT scores received today.
- Based on X out of Y chats, where Y is the number of chats which were closed by agents until now today and X is the number of chats that received a CSAT until now today.

Note:
- CSAT is credited to the user who was last assigned to the chat. If it happens that a different user had closed a chat without assigning it to themselves, the CSAT will be given to the last assigned agent only.
- CSAT = (Number of positive CSAT scores/ Total number of CSATs received)*100
- CSAT scores of thumbs up or 4 or 5 are considered positive.
- CSAT scores of thumbs down or 1, 2, or 3 are considered negative.
2. BOT CSAT
This widget will show you the customer satisfaction (CSAT) score of the Bot. The widget will show 3 important things
- Aggregate CSAT scores received by the bot till now starting at 00:00 hrs today.
- Percentage distribution of CSAT scores received today.
- Based on X out of Y chats, where Y is the number of chats which were closed by the bot until now today and X is the number of chats that received a CSAT until now today. This excludes the chats assigned to an agent but the bot closed them due to inactivity etc.

Note:
- CSAT = (Number of positive CSAT scores/ Total number of CSATs received) *100
- CSAT scores of thumbs up or 4 or 5 are considered positive.
- CSAT scores of thumbs down or 1, 2 or 3 are considered negative.
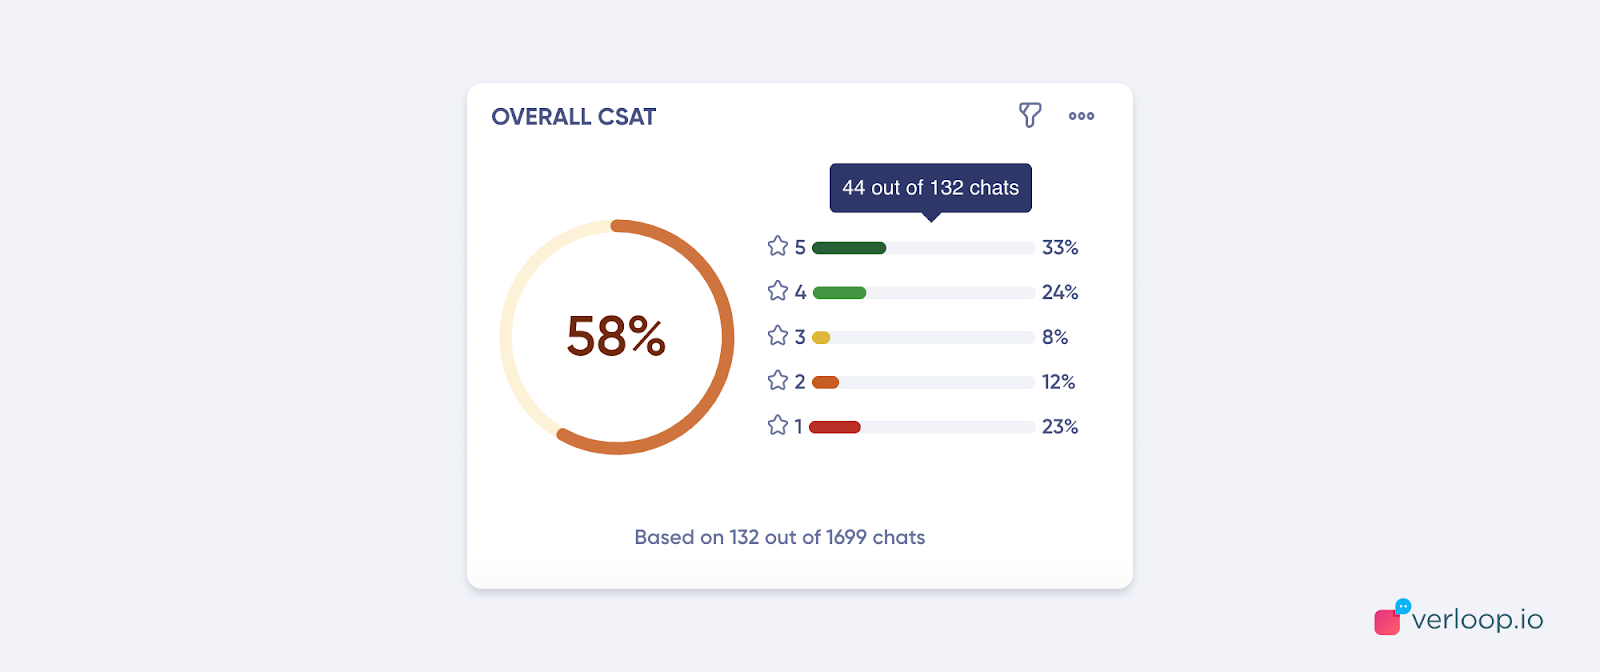
3. Overall CSAT
This widget will show you the overall customer satisfaction (CSAT) scores. The widget will show 3 important things
- Aggregate CSAT scores received on all chats till now starting at 00:00 hrs today. This includes both bot-closed and agent-closed chats.
- Percentage distribution of CSAT scores received today.
- Based on X out of Y chats, where Y shows the number of chats which were closed by Client id until now today and X is the number of chats that received a CSAT until now today.
Note:
- CSAT = (Number of positive CSAT scores/ Total number of CSATs received) *100
- CSAT scores of thumbs up or 4 or 5 are considered positive.
- CSAT scores of thumbs down or 1, 2, or 3 are considered negative.
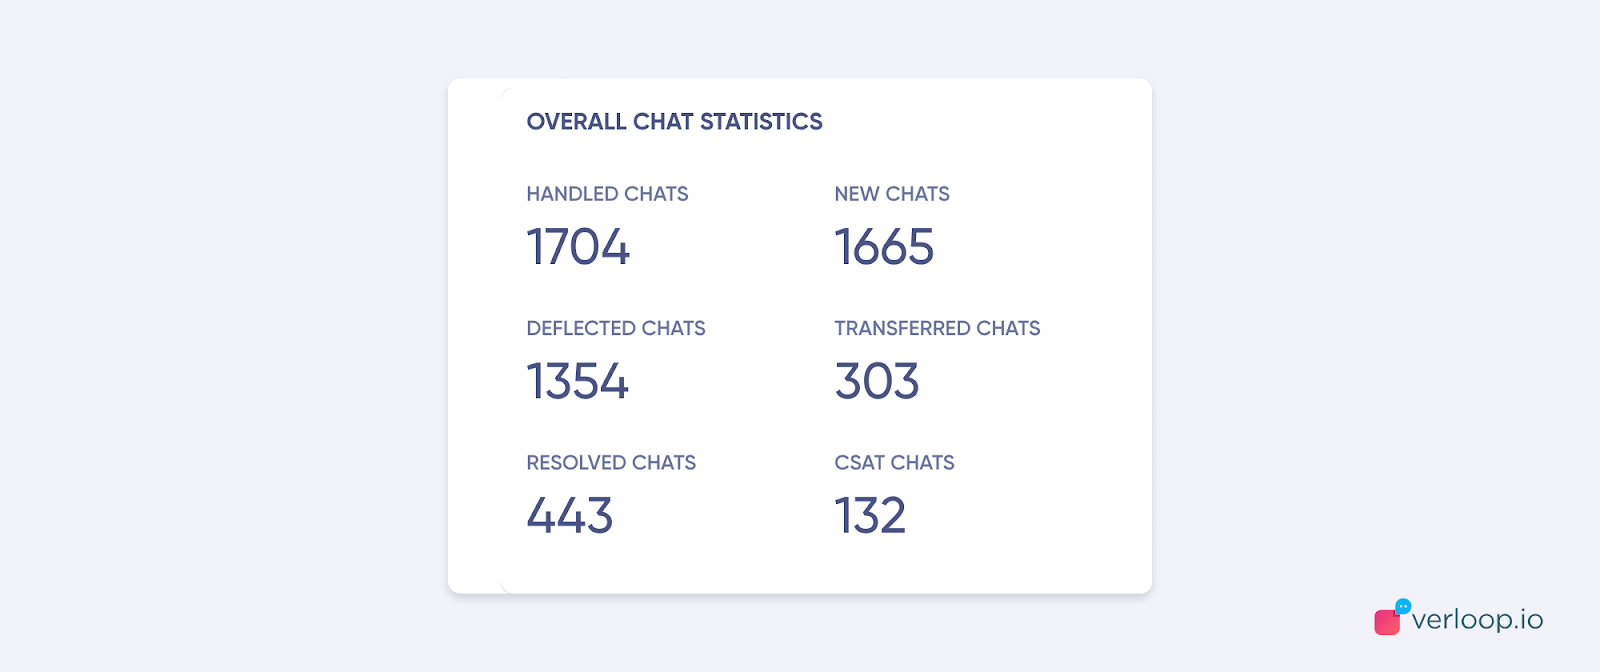
4. Overall Chat Statistics
The overall chat statistics widget shows 6 volume-based metrics
- Handled chats
- This metric shows the cumulative sum of the chats which had any activity by the end customer/Bot/Agent till now after 00:00 hrs today.
- This also includes chat which started outside today.
- New Chats
- This metric shows the cumulative sum of the chats which had any activity by the end customer/Bot/Agent till now after 00:00 hrs today.
- This includes chats which started only today (the current day).
- Deflected Chats
- This metric shows the cumulative sum of the chats which were closed by the bot till now after 00:00 hrs today.
- Transferred Chats
- This metric shows the cumulative sum of the number of transfers that were made on all the chats till now after 00:00 hrs today.
- Resolved Chats
- This metric shows the cumulative sum of the number of chats that were resolved or marked closed by all the agents till now after 00:00 hrs today.
- CSAT Chats
- This metric shows the cumulative sum of the number of chats that received CSATs till now after 00:00 hrs today.
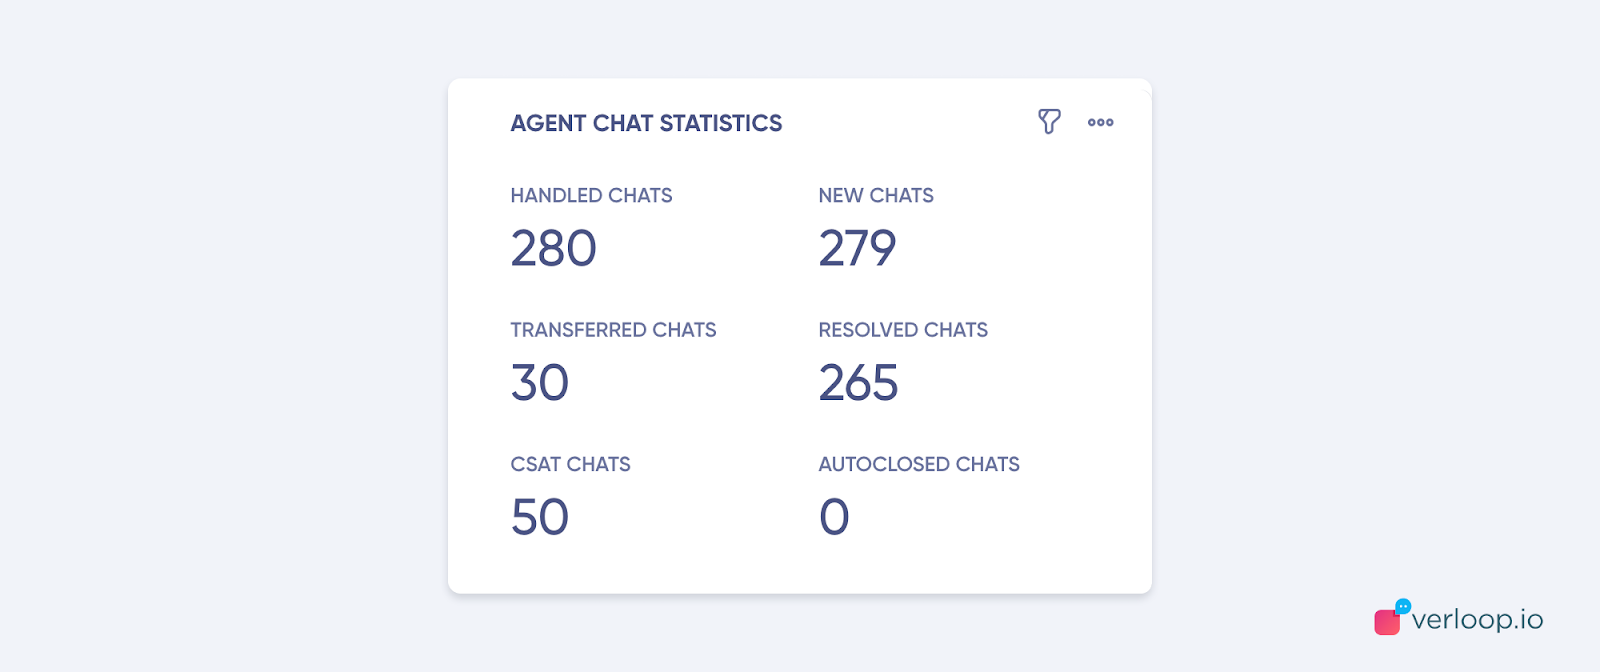
5. Agent Chat Statistics
This widget shows 6 volume-based metrics for agents’ chats
- Handled Chats
- This metric shows the cumulative sum of the chats which had any activity by Agents till now after 00:00 hrs today.
- This also includes chat which started outside today (the previous day)
- New Chats
- This metric shows the cumulative sum of the chats which were assigned to agents and had any activity by them till now after 00:00 hrs today.
- This includes chats which started only today.
- Transferred Chats
- This metric shows the cumulative sum of the number of transfers that were made by the agents on chats till now after 00:00 hrs today.
- Resolved Chats
- This metric shows the cumulative sum of the number of chats that were resolved or marked closed by all the agents till now after 00:00 hrs today.
- Autoclosed Chats
- This metric shows the cumulative sum of the number of chats that were assigned to agents but were auto-closed by the bots till now after 00:00 hrs today.
- CSAT Chats
- This metric shows the cumulative sum of the number of chats that were closed by agents and received CSATs till now after 00:00 hrs today.
6. Bot Chat Statistics
This widget shows 6 volume-based metrics for Bot chats
- Handled Chats
- This metric shows the cumulative sum of the chats which had any activity by the end customer/Bot/Agent till now after 00:00 hrs today.
- This also includes chat which started outside today (the previous day) .
- New Chats
- This metric shows the cumulative sum of the chats which had any activity by the end customer/Bot/Agent till now after 00:00 hrs today.
- This includes chats which started only today.
- Deflected Chats
- This metric shows the cumulative sum of the chats which were closed by the bot till now after 00:00 hrs today.
- Transferred Chats
- This metric shows the cumulative sum of chats that were transferred by the bot till now after 00:00 hrs today.
- Autoclosed Chats
- This metric shows the cumulative sum of the number of chats that were assigned to agents but were auto-closed by the bot till now after 00:00 hrs today.
- CSAT Chats
- This metric shows the cumulative sum of the number of chats that received CSATs till now after 00:00 hrs today.

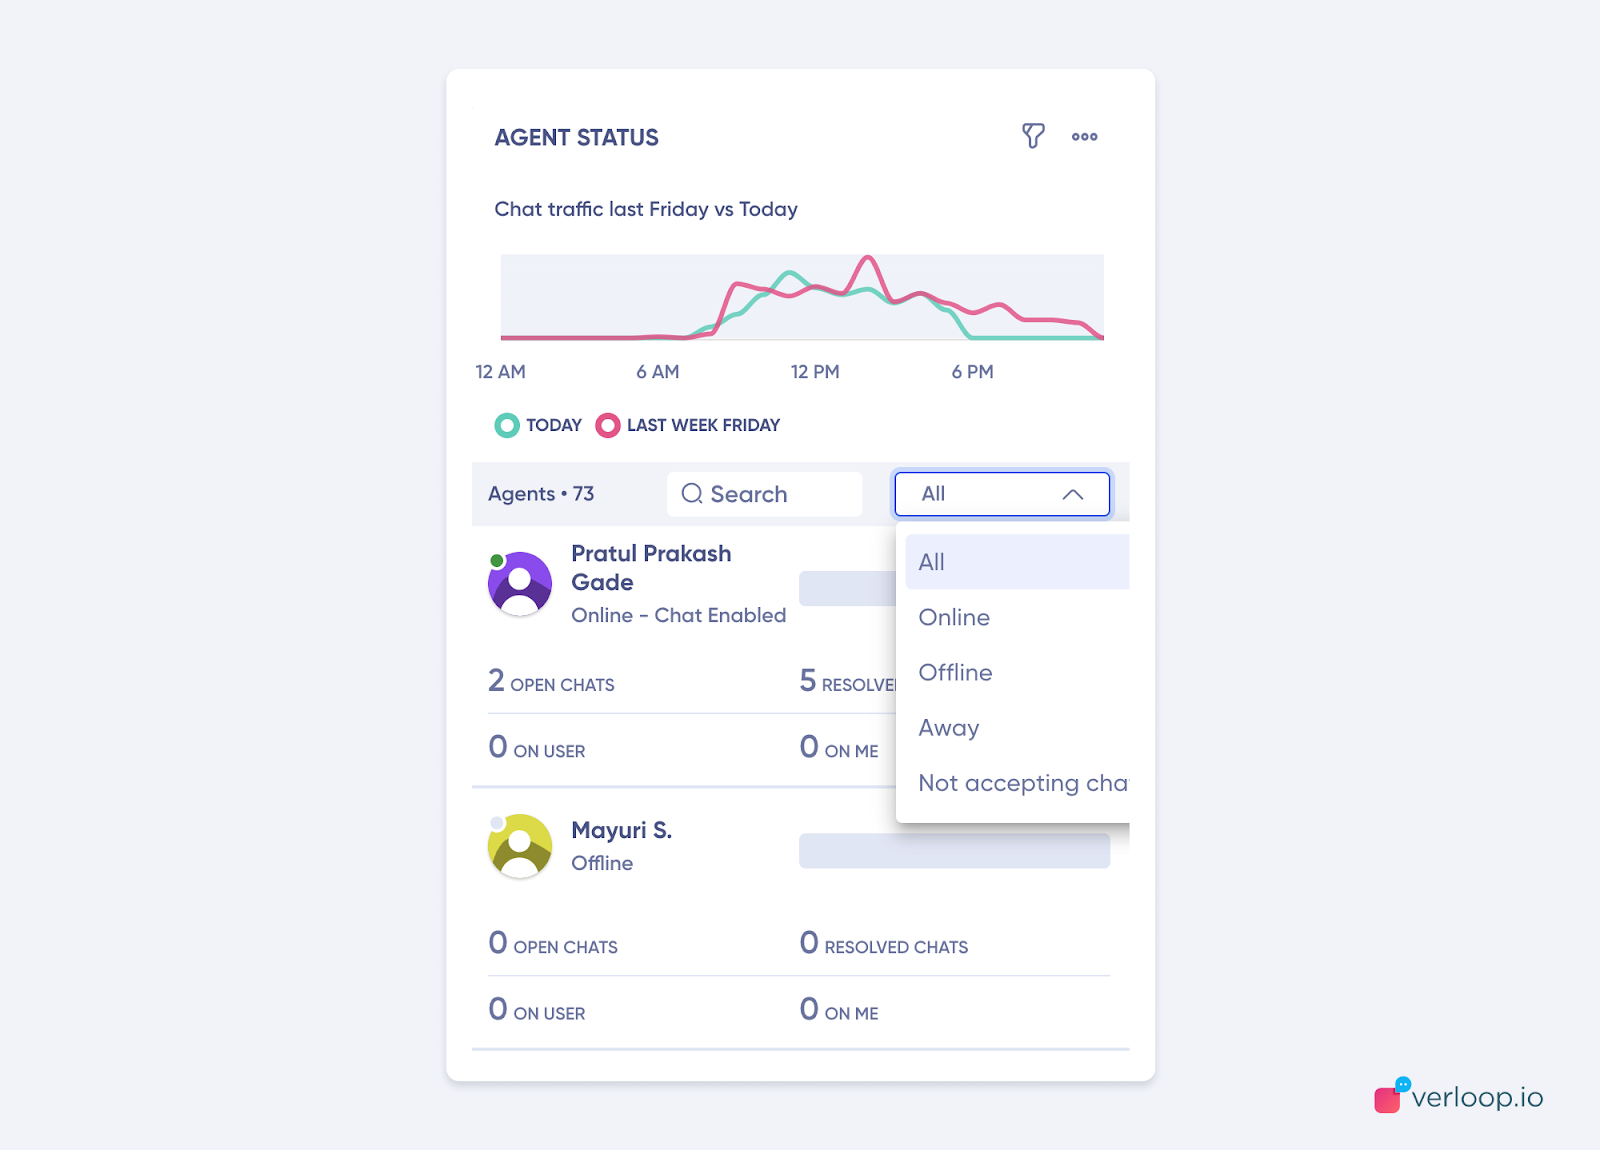
7. Agent Status
The Agent status widget helps to understand the availability of your agents on the Verloop.io platform. Agent’s status visually represents what each of your agents is doing on the platform. It shows the count of
- Open chats
- Resolved chats
- Waiting on user chats
- Waiting on me chats
- 24 hr timeline representation of the agent’s presence on the platform
- Flux of incoming chats to your agents on an hourly basis
- It allows the admins to force logout agents if needed
Note: For Open chats, Waiting on user chats and Waiting on me chats, the data will account for chats spanning the last 20 days only. Resolved chats will show present-day chats only.

8. Team Capacity
The team capacity widget helps to view the workforce strength available on your platform. The information panel further breaks down the data into 6 categories
- All Agents
- The total number of agents who are registered on the platform.
- Offline Agents
- The total number of agents who are logged out of the platform
- Away Agents
- The total number of agents who are logged in but deemed to be away from the platform.
- If your agents have moved to a different tab or application for X min, the Verloop.io platform deems them to be temporarily away.
- Online Agents
- The total number of agents who are logged onto the platform and are active.
- Agents Accepting Chats
- The total number of agents who are online and have turned on Accept chats toggle or have used Accept chats as a presence reason while not being marked away.
- Agents Not Accepting Chats
- The total number of agents who are online and have turned off Accept chats toggle or have used any other presence reason except accept chats while not being marked away.

9. Hourly Chat Traffic
This widget on hourly chat traffic helps you observe and estimate the flux of incoming chats to the platform or a department. This chart represents the total number of chats coming to your platform cumulated per hour.

10. Chat Status
The chat status widget shows the momentary status of chats across the platform. The information panel is further divided into 6 categories.
- Open Chats
- Chats in Queue
- Chats Waiting on Me
- Chats Waiting on User
- Agent Open Chats
- Bot Open Chats
Note: These will account for chats spanning the last 20 days only

11. Overall Response Statistics
The overall response statistics widget shows 6 response-based metrics
- Average First Response Time
- When No filter is applied
- It is the time taken by the bot to send the first message on the conversation since the conversation started.
- We show the average first response times of all the agents who have handled chats under that department only.
- When the Department filter is applied
- It is the time taken by the agent to send the first message after the chat is picked/assigned to the individual.
- Only chats which are assigned to the department first and then picked by the corresponding agent will be considered here.
- When a department filter is applied, we consider the average first response times of all the agents who have handled chats under that department only
- When No filter is applied
- Average Response Time
- When No filter is applied
- It is the time taken by the bot and agents to send the response message for every customer message on the conversation since the conversation started.
- If a customer sends two or more continuous messages before the agent/bot replies, we consider the first message of the set for the customer and then the first message of the agent for calculating response time.
- We consider the average of all response times of all the agents who have handled chats under that department only.
- When the Department filter is applied
- It is the time taken by the agents to send the response message for every customer message on the conversation after the chat is picked by the agent.
- If a customer sends two or more continuous messages before the agent/bot replies, we consider the first message of the set for the customer and then the first message of the agent for calculating response time.
- Only chats which are assigned to the department first and then picked by the corresponding agent will be considered here.
- When a department filter is applied, we consider the average of all response times of all the agents who have handled chats under that department only.
- When No filter is applied
- Average Handling Time
- When No filter is applied
- It is the time since the chat was handled by a bot or agent till the time the chat was closed.
- We consider the average of all handling times of all the chats handled today.
- When the Department filter is applied
- It is the time between an agent from the chosen department picking the chat till the agent transfers the chat to other departments/agents or closes the chat.
- In case the same chat comes back to an old agent, we take the cumulative sum of both handling times.
- We consider the average handling times of all the chats handled by agents in the department today.
- When No filter is applied
- Average Queue Time
- When no filter is applied
- It is the average time spent by all the chats in the queue i.e. time since the chat was put in a queue and some agent picks the chat.
- When a department filter is applied
- It is the average time spent by chats in department-specific queues.
- When no filter is applied
- Average Resolution Time
- When No filter is applied
- It is the time since the conversation started till the conversation was closed.
- We consider the average of all the resolution times of all the chats handled today.
- When the Department filter is applied
- It is the time spent by the agent since picking a chat and closing it.
- In the case a user closes a chat without assigning it to themselves, resolution time will be credited to the last attached user at the time of closing the chat.
- We consider the average of all the resolution times of all the chats closed by agents by being in the department today.
- When No filter is applied
- Average CSAT Response Time
- When no filter is applied
- It is the time since CSAT was triggered till the CSAT feedback was submitted
- When a department filter is applied
- It is the CSAT response time for the chats which were closed by agents under the chosen departments.
- When no filter is applied

12. Bot Response Statistics
The Bot response statistics widget shows 6 response-based metrics
- Average First Response Time
- The time taken by the bot to send the first message on the conversation since the conversation started.
- Average Response Time
- The average time taken by the bot to send the response message for every customer message on the conversation since the conversation started.
- If a customer sends two or more continuous messages before the bot replies, we consider the first message of the set for the customer and then the first message of the bot for calculating response time.
- We consider the average of all the response times of the bot across all the chats handled.
- Average Handling Time
- The Time spent by the bot handling a chat.
- We consider the average of all the handling times of all the chats handled by the bot today.
- Average Queue Time
- The average time spent by all the chats in the queue i.e. time since the chat was put in a queue and some agent picks the chat up.
- Average Resolution Time
- The time spent by the bot in closing a conversation without human intervention.
- We consider the average of all the resolution times of all the chats handled today.
- Average CSAT Response Time
- When no filter is applied
- The time since CSAT was triggered till the CSAT feedback was submitted.
- When no filter is applied

13. Agent Response Statistics
The agent response statistics widget shows 6 volume-based metrics
- Average First Response Time
- When No filter is applied
- The time taken by the agent to send the first message on the conversation since the conversation started.
- We show the average of all the first response times of all the agents who have handled chats under that department only
- When the Department filter is applied
- The time taken by the agent to send the first message after the chat is picked/assigned to the individual.
- Only chats which are assigned to the department first and then picked by the corresponding agent will be considered here.
- When a department filter is applied, we consider the average of all the first response times of all the agents who have handled chats under that department only
- When No filter is applied
- Average Response Time
- When No filter is applied
- The time taken by the agents to send the response message for every customer message on the conversation since the conversation started.
- If a customer sends two or more continuous messages before the agent/bot replies, we consider the first message of the set for the customer and then the first message of the agent for calculating response time.
- We consider the average of all response times of all the agents who have handled chats under that department only.
- When the Department filter is applied
- The time taken by the agents to send the response message for every customer message on the conversation after the chat is picked by the agent.
- If a customer sends two or more continuous messages before the agent/bot replies, we consider the first message of the set for the customer and then the first message of the agent for calculating response time.
- Only chats which are assigned to the department first and then picked by the corresponding agent will be considered here.
- When a department filter is applied, we consider the average of all response times of all the agents who have handled chats under that department only.
- When No filter is applied
- Average Handling Time
- When No filter is applied
- The time since the conversation was assigned to agent till the conversation was closed.
- We consider the average of all handling times of all the chats handled today.
- When the Department filter is applied
- The time between an agent from the chosen department picks the chat till the agent transfers the chat to other departments/agents or closes a chat.
- In case the same chat comes back to an old agent, we take the cumulative sum of both handling times.
- We consider the average of all the handling times of all the chats handled by agents by being in the department today.
- When No filter is applied
- Average Waiting Time
- When no filter is applied
- The average time spent by all the chats in waiting on me + waiting on user time i.e. the time since the chat was put in either of the above statuses and some agent picks the chat.
- When a department filter is applied
- Average waiting time spent by chats in respective departments.
- When no filter is applied
- Average Resolution Time
- When No filter is applied
- The time since the conversation was assigned to an agent till the conversation was closed by the same agent.
- Resolution time is attached to the person who is last assigned to the conversation when the chat is being closed.
- We consider the average of all the resolution times of all the chats handled today.
- When the Department filter is applied
- The time spent by the agent since picking a chat and closing it.
- In the case a user closes a chat without assigning it to themselves, resolution time will be credited to the last attached user at the time of closing the chat.
- We consider the average of all the resolution times of all the chats closed by agents by being in the department today.
- When No filter is applied
- Average CSAT Response Time
- When no filter is applied
- The time since CSAT was triggered till the CSAT feedback was submitted
- When a department filter is applied
- CSAT response time for the chats which were closed by agents under the chosen departments.
- When no filter is applied

Agent Availability Overview
This widget gives an overview of your agents’ activities in real-time such as current status, present status, etc.
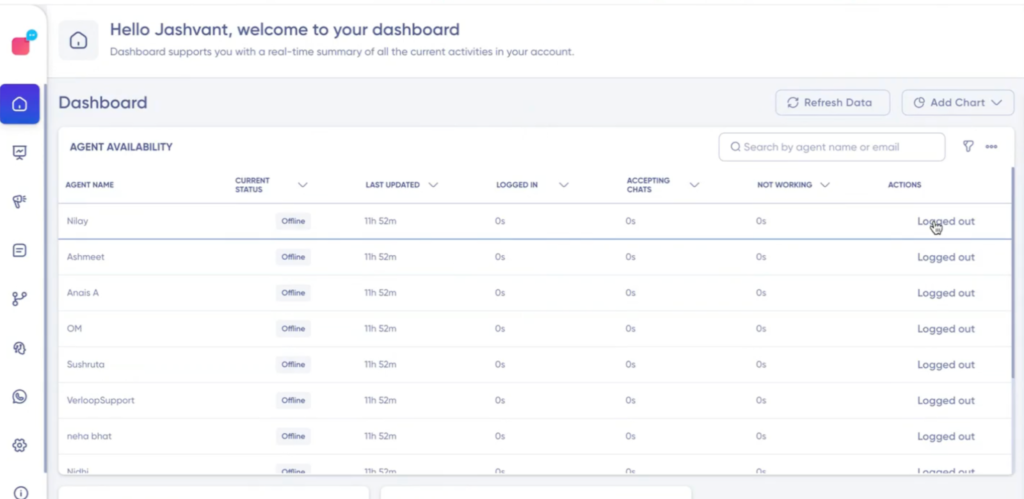
Current Status: Current Status displays the present status of each agent. Utilise the column filter to view specific statuses (e.g., Accepting Chats, Offline, Tea break, Lunch, etc).
Last Updated: The “Last Updated” column indicates when the agent’s status was last updated. This is helpful for tracking breaks or other status changes. Note: The last updated time by default starts at midnight, considering a 24-hour interval.
Logged In: The total time an agent spent logged in during the day. You can sort this out in descending or ascending order based on your needs.
Accepting Chats: The total time an agent spends in accepting chats. You can sort this out in descending or ascending order based on your needs.
Not Working: The total time an agent is on break and is not able to accept chats. You can sort this out in descending or ascending order based on your needs.
Actions: This column displays the status of agents, indicating whether they are logged in or logged out.
Customise Views with Filters
The initial filter/search option allows you to simply enter the agent’s name or email ID to access and review their activity, as illustrated below.

You have the option to organise the view by applying a department filter, allowing you to choose the specific department metric you wish to display.

Agent Performance
The Agent Performance widget offers real-time updates on chat conversation status, assignment status, and status duration breaches. Here’s what you can monitor:
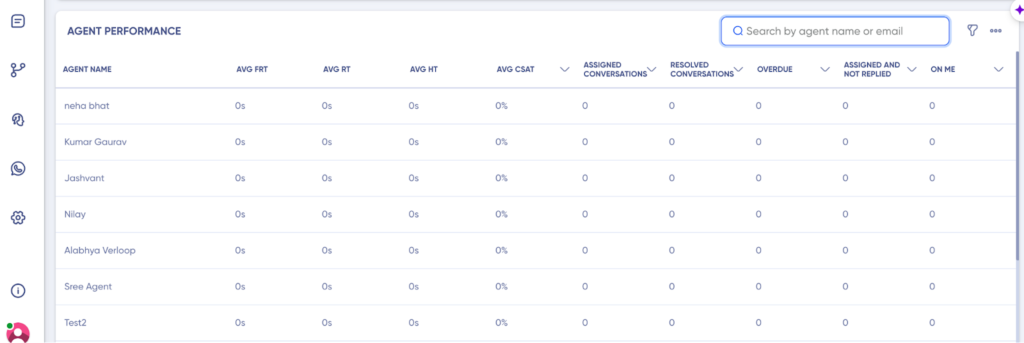
Average First Response Time (Avg FRT)
- Definition: Avg FRT represents the average time it takes for an agent for first response after a chat is assigned.]
- Example: Customer A starts a chat at 10:00 AM, and the agent 1 responds at 10:01 AM. Customer B initiates a chat at 11:00 AM, and the agent 1 replies at 11:02 AM. The Avg FRT of agent 1 is (1 minute + 2 minutes) / 2 = 1.5 minutes.
2. Average Response Time (Avg RT)
- Definition: Avg RT is the average time it takes for an agent to reply to any customer messages.
- Example: Customer X sends a message at 10:00 AM, and the agent replies at 10:01 AM. Another message comes in at 10:02 AM, and the agent replies at 10:04 AM. The RTs for these interactions are 1 minute and 2 minutes, respectively. The Avg RT is (1 minute + 2 minutes) / 2 = 1.5 minutes.
3. Agent Average Handling Time (Avg HT)
- Definition: Avg HT is the average duration an agent spends handling customer interactions, from chat assignment to successful conclusion.
- Example: Agent Y starts addressing a query at 10:00 AM and resolves it by 10:05 AM. Another interaction begins at 10:07 AM and concludes at 10:10 AM. The respective AHTs are 5 minutes and 3 minutes. The Avg HT for the agent is (5 minutes + 3 minutes) / 2 = 4 minutes.
4. Average Customer Satisfaction (Avg CSAT)
- Definition: Avg CSAT measures the average satisfaction level reported by customers regarding interactions with customer service agents.
- Example: After each interaction, customers rate their satisfaction. If Customer Z rates 4 out of 5, and Customer W rates 5 out of 5, Customer X rates 2 out of 5 , the Avg CSAT score is (2)*100 / 3 = 66.6%.
5. Assigned Conversations
- Definition: The number of conversations assigned to a specific agent.
- Example: Agent P is assigned 20 conversations throughout the day, indicating the workload they are managing.
6. Overdue
- Definition: The number of conversations open beyond the stipulated SLA time.
- Example: If an agent fails to resolve a chat within the default SLA time(configurable via filter) of 15 minutes, and there are 5 such conversations, they are considered overdue.
7. Assigned and Not Replied
- Definition: Conversations assigned to an agent but not responded to within the SLA time.
- Example: Agent Q has 5 assigned conversations where they have not responded within the specified SLA time, possibly requiring attention.
8. On Me
Definition: Conversations assigned to the agent and currently in a “Waiting on Me” status.
Example: Agent R has 3 conversations awaiting their attention, marked as “Waiting on Me.”
9. On User
Definition: Number of conversations where the agent initially responded, but the customer has not replied or left the chat and marked it as Waiting on customer status.
Example: Agent S has 2 conversations in which customers did not respond after the initial agent reply, possibly indicating a need for follow-up.
10. Open
Definition: Number of chats that are still open, either automatically or intentionally left unresolved by the agent.
Example: Agent T has 8 open chats that require attention or resolution, indicating ongoing customer interactions.
Customise Views with Filters
The initial filter/search option allows you to simply enter the agent’s name or email ID to access and review their performance, as illustrated below..

Filter Options in Metrics Display
In addition to the primary filters mentioned above, you have two additional options to tailor the metrics view according to your preferences.
1. Department Filter:
Description: This filter enables you to organize the metrics view based on specific departments. You can choose a particular department to display metrics related to that department exclusively.
How to Use: Simply select the desired department from the available options, and the metrics table will update accordingly, focusing solely on the chosen department’s data.
2. SLA (Service Level Agreement) Filter
Description: The SLA filter provides a customizable way to set time limits for monitoring metrics based on specific intervals. You can establish personalized thresholds for various metrics, allowing for fine-tuned monitoring.
How to Use: After selecting the SLA filter, you can input custom time limits in the provided space. This allows you to define specific intervals for metrics monitoring. Once applied, the metrics table will refresh, displaying data based on the customized SLA filters on respective columns.
Note: After applying any filters, the entire table updates to reflect the filtered data, making it convenient for you to analyze and sort the metrics according to your specific criteria.

Notes:
Multi-Department Filters
Select the desired departments to narrow down the data on applicable widgets, providing a comprehensive view of performance across various departments.
- Applicable Widgets: Agent Chat Statistics, Agent Status, Hourly Chat Traffic, Chat Status, Overall Chat Statistics, Agent Availability, Agent Performance, Team Capacity.
- How to Apply?
1. Click on the filter option on the widget.
2. Select the desired departments.
3. Click ‘Apply’ to activate the filters.
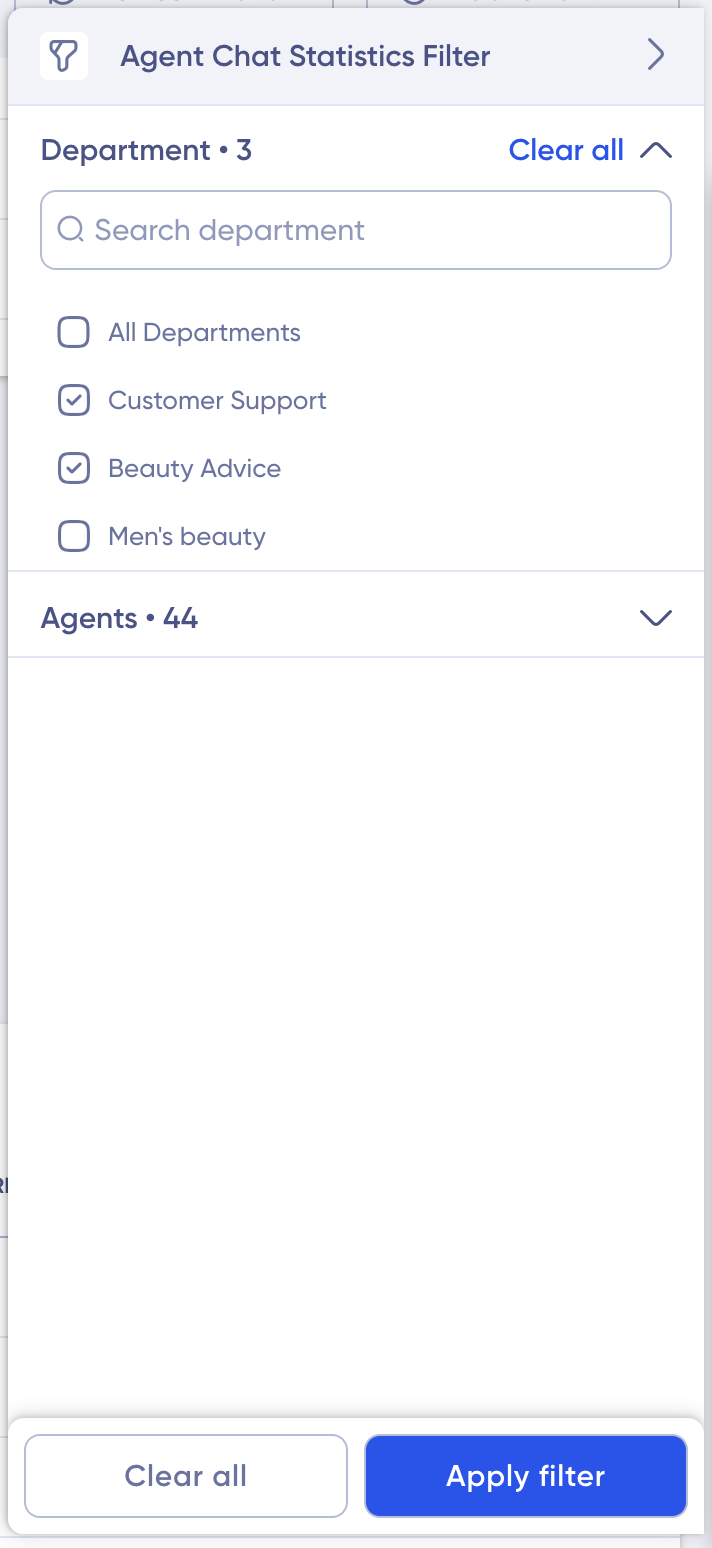
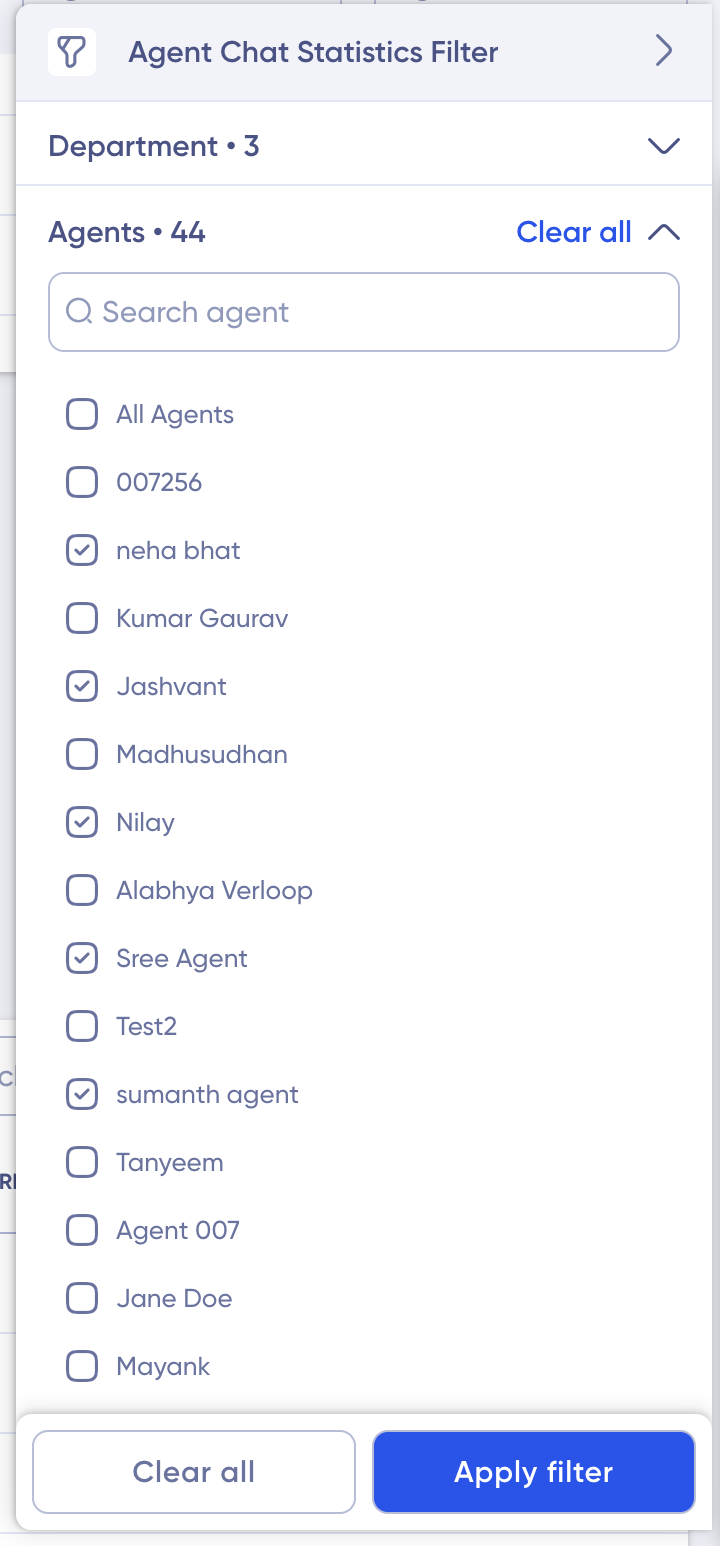
Multi-Agent Filters
In addition to department selection, choose multiple agents to further refine the data, allowing for in-depth analysis of agent performance within selected departments.
- Applicable Widgets: Agent Chat Statistics, Agent Status, Hourly Chat Traffic, Chat Status, Overall Chat Statistics, Agent Availability, Agent Performance.
- How to Apply?
1. Click on the filter option on the widget.
2. Select the desired departments and the desired agents.
3. Click ‘Apply’ to activate the filters.
For the CSAT and Response Statistics widgets ie. Overall CSAT, Agent CSAT, Agent Response Statistics and Overall Response Statistics Widgets, you can select a single department and drill down to a single agent within that department for more detailed insights.
Benefits
- Real-time Update Tracking: Keeps you informed about agent availability status with visibility into the most recent updates.Facilitates better decision-making when assigning inquiries or managing department availability.
- Streamlined Group Focus: Incorporates a group filtering mechanism for concentrated attention on specific team segments, optimizing resource allocation.
- Effective Manual Assignment: Empowers administrators to assign inquiries to designated agents, streamlining routing for efficient responses and improved customer experiences.
Adding and Customizing Widgets:
- If you’re an admin or manager, add agent performance and agent availability widgets from the “Add Charts” interaction.
- Default settings hide these widgets; admins/managers can choose to add them from the menu.
- Widgets can be moved around the board for a personalized dashboard layout, ordered alphabetically for ease of navigation.
If you have any questions, please feel free to reach out to us at support@verloop.io