Verloop.io’s Overall Dashboard offers you a consolidated view of all your chats, bot and agent performance and customer behaviour in one unified location. With the help of data visualization tools such as tables, widgets, and charts, you get KPI information in one glance.
Our goal is to help you monitor your Verloop.io bot and agent performance, identify trends, make informed decisions, identify outliers, and set targets for future work.
The information on the overall dashboard is segregated into three sections.
- Agent Status
- Overall Dashboard
- Goal Completion (Beta)
Each of these sections has multiple widgets and helps you track past data. Let’s look at them in detail
Looking for specific information? Click the link below to jump directly to that section
- Agent Status
- Overall Dashboard
- CSAT
- Chat Statistics
- Resolved by bot %
- Overall KPIs
- Department-wise KPIs
- Top Agents
- Goal Completion (Beta)
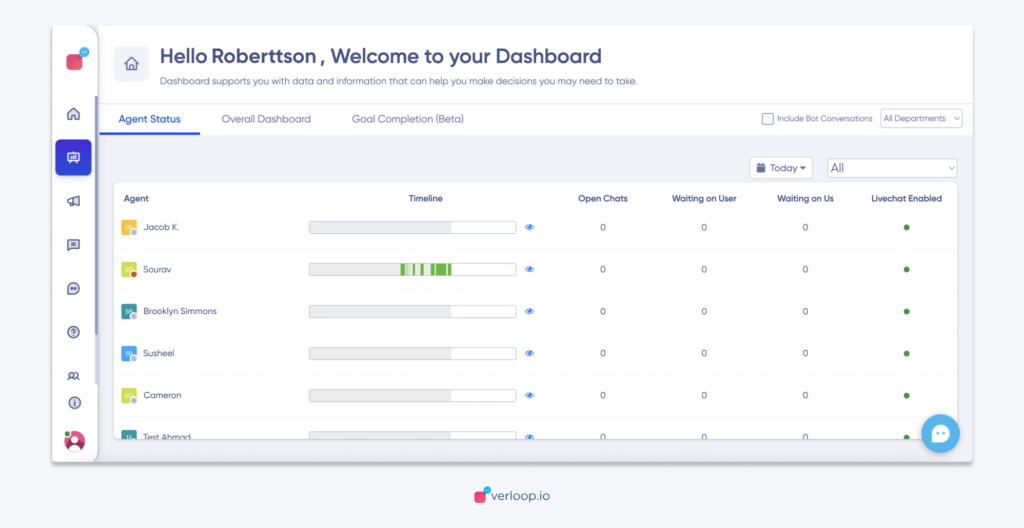
Agent Status
In the first section of the overall dashboard, you can see a list of your agents, check their availability on the Verloop.io platform, and the status of chats assigned to them.
Agent’s status visually represents what each of your agents is doing on the platform. It shows the count of
- 24 hr timeline representation of the agent’s presence on the platform
- Open chats
- Waiting on user
- Waiting on me
- If live chat is enabled or not

When the admin clicks on the eye icon next to the timeline, they will be able to see details on the agent’s activity, such as
- Working hours
- Not working hours
- Logged out time
- Availability for chat
- Timeline of how when they logged in and out, duration of working hours and current status.
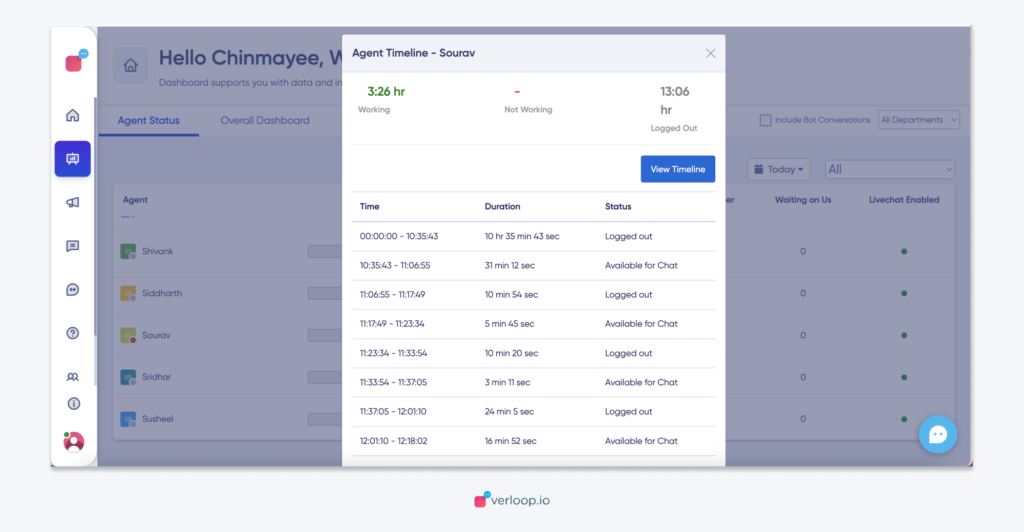
Admins can also filter the list of agents based on their department and check activity for a specific date.
Overall Dashboard
You can see 6 widgets in this section. Admins can use the following filters (top right corner)
- Include bot conversations: which chats closed by bot + chats closed by agents. If this filter is not applied, then you see chats closed by Agents only
- Department filter: you can see the chats closed by agents only for selected departments.
CSAT
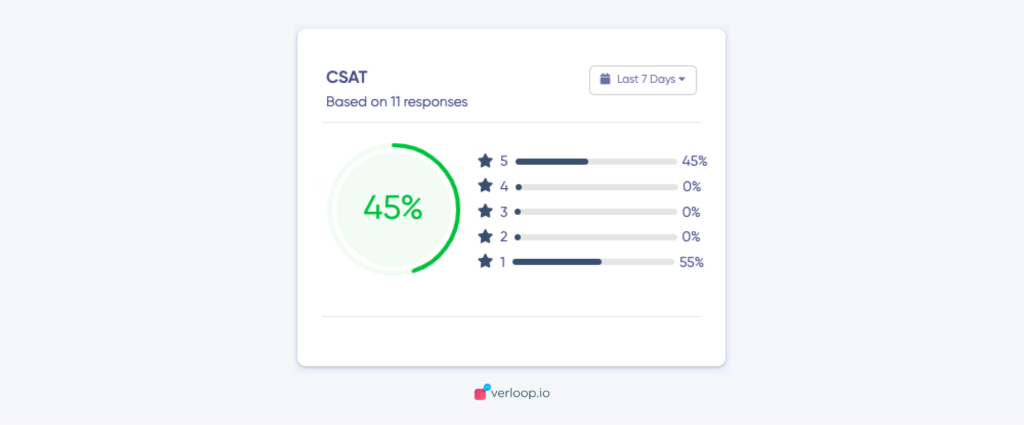
This shows the CSAT score in % from the no of registered CSAT scores till now. The distribution of chat counts who rated 1, 2, or 3 (Thumbs Down) and 4 or 5 (Thumbs Up) is also provided here as % of total CSATs registered in the selected period.
CSAT formula for 5 stars
CSAT= (Number of satisfied customers [4 and 5] / Number of survey responses) x 100 = % of satisfied customers
CSAT formula for thumbs up/down
CSAT= (Number of thumbs up/Number of survey responses) X 100
Admins can use the following filters on this widget
- Date: You can see this data for
- Today
- Yesterday
- Last 7 Days
- Last 30 Days
- Custom Range
- Include bot conversations
- Department filter
Chat Statistics
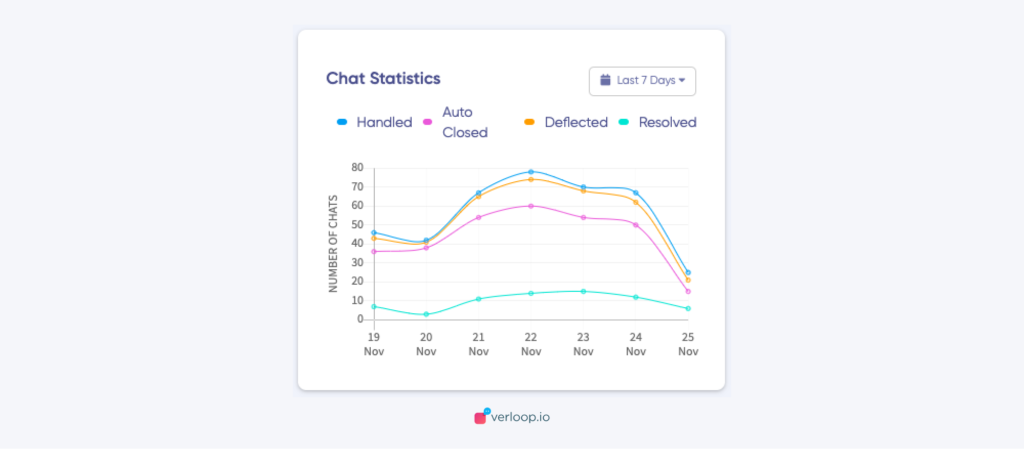
The chat statistics widget shows a graph of the number of chats across a timeline for 4 parameters
- Handled chats
- This metric shows the cumulative sum of the chats which had any activity by the end customer/Bot/Agent till now after 00:00 hrs today.
- This also includes chat which started outside today.
- Auto-closed chats
- This metric shows the cumulative sum of the number of chats that were assigned to agents but were auto-closed by the bots till now after 00:00 hrs today.
- Deflected chats
- This metric shows the cumulative sum of the chats which were closed by the bot till now after 00:00 hrs today.
- Resolved chats
- This metric shows the cumulative sum of the number of chats that were resolved or marked closed by all the agents till now after 00:00 hrs today.
Admins can use the following filters on this widget
- Date: You can see this data for
- Today
- Yesterday
- Last 7 Days
- Last 30 Days
- Custom Range
- Include bot conversations
- Department filter
Resolved by bot %
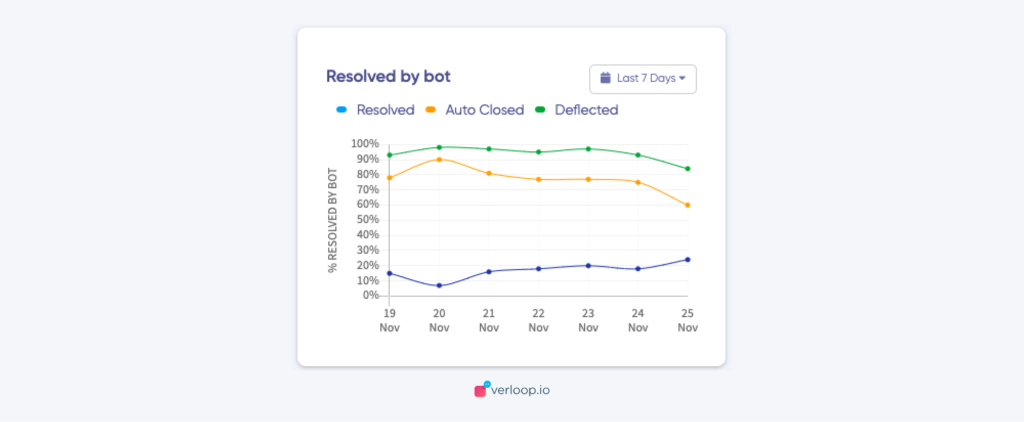
This widget shows the percentage of chats closed by the bot with respect to incoming chats during a selected period.
Resolved by bot means the chats which were either closed by the bot using
- a webhook (from the backend) or
- our close block in the recipe
It doesn’t include
- System closure like inactive chat rooms, webhook failures/system failures /auth failures etc.
For this widget, you cannot apply the ‘include bot conversations’ and ‘Department’ filters here. Admins can only use the Date filter.
Overall KPIs
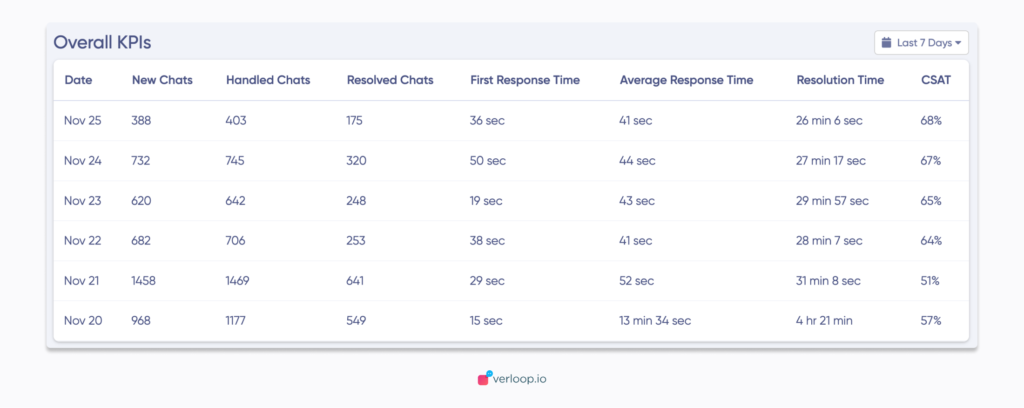
This widget shows data day-wise on how many chats came in and were handled or resolved with what quality of resolution. This widget includes both BOT and Agent handled chats.
Admins can see the following data in this widget:
- Date
- New chats: Chats that are freshly started in the selected time period.
- Handled chats: Fresh chats and chats which started on a different day but were handled during the selected time period
- Resolved chats: Chats which were resolved by both bot + agents. It includes chats closed by
- bot using a webhook close configuration from the backend or
- bot using our close block in the recipe
- Agents
Note: Not all closed chats are resolved chats.
- First response time: The average of all time spans between the first visitor message and the immediate next message by an agent of all the closed chats. This metric considers only the agent’s first response to calculate FRT
- Average response time: The average of all the time spans between a visitor message and bot/agent message of all the closed chats. This metric considers in the same order of events i.e., first visitor message then bot/agent message
- Resolution time: The average time span between the chat end time and the chat start time of all the closed chats
- CSAT: Average of both bot and agent CSAT of all the closed chats is included here.
Department-wise KPIs
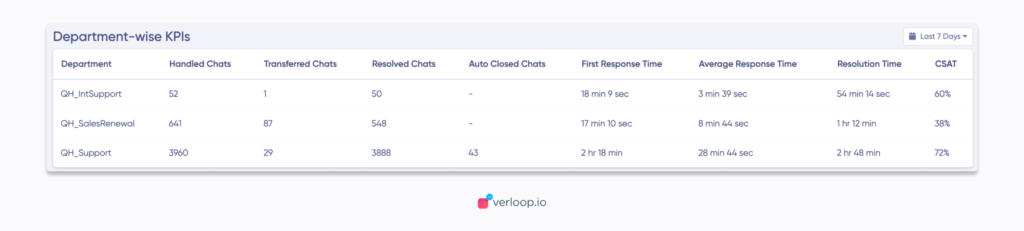
This widget shows department-wise data as a whole in the selected time period. This widget includes only Agent handled chats since the bot doesn’t fall under any department.
P.S. It is not necessary that a chat closed by an agent has to be under a department. The recipe has to be defined to put the chat in a specific department queue and after that, if any agent picks it, it falls under a department. Otherwise, it only attributes to an agent and not any department.
In case a chat is assigned to an agent, and it is then closed by the BOT stating inactive room, this is not attributed as resolved by any department or agent. It is considered as only handled by the department or agent and is considered as closed by a bot.
Admins can see the following data in this widget:
- Department name
- Handled chats: The number of chats that were handled by a department i.e. new and previously ongoing chats which were handled between the selected period.
- Transferred chats: The number of chats that were transferred to another department from the current department.
- Resolved chats: The number of chats which were resolved by the department.
- First response time: The average time between the chat being assigned to a department and the Agent’s first message. This includes
- The time the chat spent under a department where the chat was unassigned to an agent because of agent unavailability +
- The time the agent took to reply with the first message after it was assigned.
- Average response time: The average of all the time spans between a user message and an agent message of all the closed chats in the specific department. This also includes the department FRT mentioned above. This metric considers in the same order of events i.e., first visitor message then bot/agent message
- Resolution time: The time taken by the department to resolve a chat is the resolution time of the department. This includes
- The time the chat spent under a department where the chat was unassigned to an agent because of agent unavailability +
- The time the agent took to reply with the first message after it was assigned.
- The time agent took to mark the chat closed.
- CSAT: Only agent CSAT is considered per department.
Top Agents
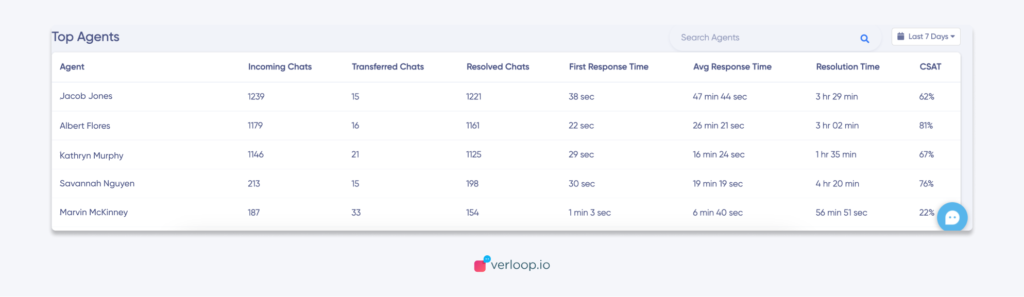
This widget shows data agent-wise (sorted in descending order based on resolved chats) as a whole in the selected time period. This widget includes only Agent handled chats. You can also search for an agent by name.
Admins can see the following data in this widget:
- Agent name
- Incoming chats: The number of chats which were assigned to a particular agent during the time frame selected.
- Transferred chats: The number of chats that were transferred by the present agent to another agent.
- Resolved chats: The number of chats which were resolved by an agent only. Resolved chats can be more than incoming chats because an agent can directly close a chat without being assigned (i.e directly from the queue) or the agent can resolve a chat which came in on a different day.
- First response time: The time the agent took to reply to the chat with the first message after it was assigned to them.
- Average response time: The average of all the time spans between a user message and an agent message of all the closed chats in the specific department. This metric considers the same order of events i.e. first user message then bot/agent message. It also considers
- The time the chat spent under a department where the chat was unassigned to an agent because of agent unavailability +
- The time the agent took to reply with the first message after it was assigned.
- Resolution time: the time span between the chat end time and the chat start time
- CSAT: Only agent CSAT is considered here.
Goal Completion (Beta)
If you want to track custom goals achieved by the bot in your flow, Goals is the right solution for you! Attaching a Goal to a specific block inside the flow can help you easily track if the user has gone through a specific path in the flow or not. A goal can be configured such that when a user reaches a particular block a goal is registered.
In this section of the overall dashboard, admins can see the goals completion rate for specific recipes and time frame based on filters (Today, Yesterday, Last 7 Days, Last 30 days, Custom Range)
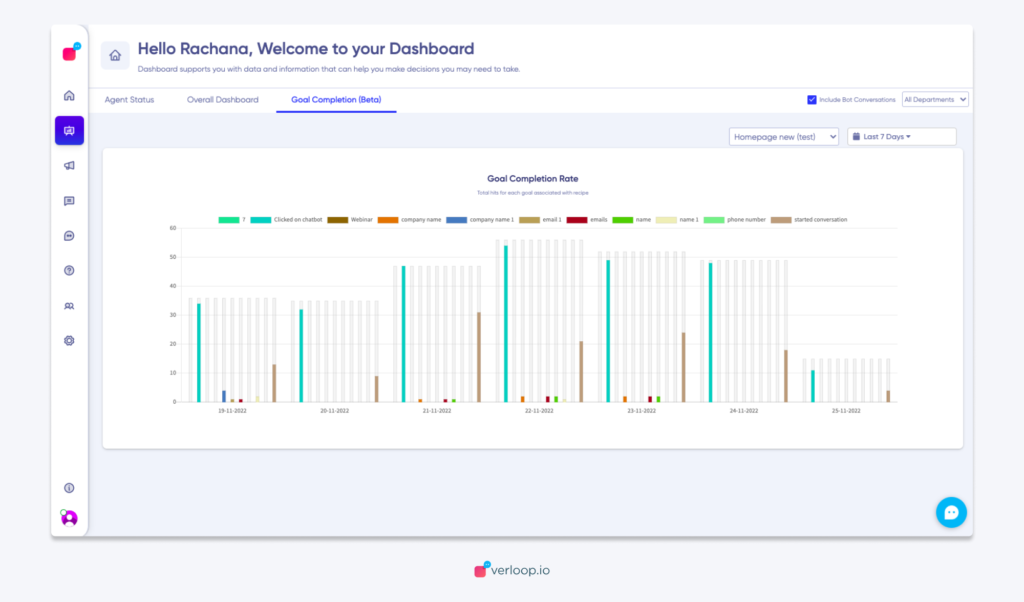
- The Y-axis from the above representation
- The light grey bars represent the total number of chats that came up on that particular day.
- The coloured bars show the count of goals achieved in those chats.
- The colours of various goals are randomly generated.
- The legends of the goals along with colour mapping provided on the top section of the graph are interactive. Users can click on them to hide/unhide Goals.
- A hover on the bar chart will show the date stamp, Name of the goal, Count of the goal achieved and the Percentage respective to the total number of chats that happened that day.